


SCOPE BANNER — Primarily US workflow / USD examples. The order of questions travels well, but taxes, insurance, mortgage rules and closing charges do not; use the local country signposts below before acting.
At a glance: the five-minute pre-offer sequence
- 1. Run affordability at the quoted rate and again at a clearly labelled stress rate; record the lower ceiling.
- 2. Confirm full monthly PITI — principal, interest, property tax and insurance — rather than principal and interest alone.
- 3. Compare deposit size with PMI/mortgage insurance and keep cash-to-close separate from the deposit.
- 4. Check front-end and back-end DTI, then run rent-versus-buy for the years you expect to stay.
- 5. Replace generic tax, insurance and closing-cost inputs with local documents before making an offer; keep a reserve after closing.
Scope and check date: this guide uses a simplified USD/US worked example and was checked on 23 August 2026. A calculator produces planning estimates, not a lender decision, appraisal, quote or guarantee. Rates, taxes, insurance, PMI, transfer charges and underwriting rules vary by jurisdiction, product and lender. Do not transfer the US 28/36 or 43% examples to another market without local verification.
| Market | Replace the US assumptions with |
|---|---|
| US | CFPB home-buying guidance, lender Loan Estimate, county tax bill and insurance quote |
| UK | UK country hub, lender affordability/LTI method, council tax and local transaction-cost guidance |
| Canada | Canada country hub, GDS/TDS and qualifying-rate rules, provincial taxes and insurance |
| Australia | Australia country hub, lender serviceability model, state duties and insurance |
| UAE | UAE country hub, lender DBR/LTV rules, emirate fees and verified income treatment |
| Localized parallel | Enter and verify before relying on the result |
|---|---|
| UK mini-workflow | Enter GBP price, deposit and lender rate; replace US tax/insurance with council tax and a local insurance quote; check the England stamp-duty worksheet where relevant. |
| Canada mini-workflow | Enter CAD price, deposit and rate; replace 28/36 with the lender's GDS/TDS and qualifying-rate test; verify provincial transfer tax and insurance. |
| Australia / UAE mini-workflow | Enter AUD or AED figures; replace DTI with the lender's serviceability or DBR/LTV method; verify state/emirate fees and local insurance. |
The most expensive mistake a buyer can make is falling in love with a house before the math. The listing photo, the street, the agent's script — all of it lands before any number, and by the time the numbers arrive they are being used to justify the decision rather than test it. Property calculators exist to break that order: run the arithmetic first, set your ceilings, and only then let yourself like things. This guide shows the exact sequence — which calculator, in which order, and what each one should tell you — with worked examples throughout.
Start with the monthly payment, not the price
The first number to know is the monthly payment, because it is the number that actually decides whether you can carry the home. The Mortgage Calculator takes the price, your down payment, the rate, and the term, and returns the full PITI — principal, interest, property tax, and insurance — plus any PMI. Treat tax, insurance and PMI defaults as placeholders until you replace them with your local bill or quote. Privacy/accessibility note: in the reviewed client-side calculator components, controls are keyboard-focusable, results use an aria-live region where applicable, and no calculator-specific localStorage, sessionStorage or submission API was found; still, do not enter SSNs, IDs or other sensitive data.
Take the site's worked example: a $400,000 home with $80,000 down at 6.5 percent for 30 years produces a $2,439.28 monthly PITI — $2,022.62 of principal and interest, $333.33 of property tax, and $83.33 of insurance. That is the number to compare against your budget. If it fits with room to spare, the price is in range; if it requires the payment to be the maximum you can manage, the house is already too expensive for you at this rate.
What you can actually borrow: the affordability pass
The Home Affordability Calculator runs the question from the other side: given your income, existing debts, down payment, rate, and term, what price can you support? The 28/36 figures are a US planning benchmark, not a universal rule and not a promise that a lender will approve the result. Use the tool to compare assumptions, then confirm the lender's current underwriting method and local affordability requirements.
Worked example: a household earning $120,000 a year ($10,000 a month) with a $700 car payment and $300 of minimum credit-card payments has $3,600 a month available at the 36 percent back-end limit. Subtracting the $1,000 of existing debt leaves $2,600 for housing. At a 6.5 percent rate with 20 percent down and typical tax and insurance, that payment supports roughly a $360,000 to $380,000 purchase — far less than the $400,000 the mortgage example above assumed. The affordability pass is where most buyers discover their real ceiling, and it is the one most skip.
The deposit and insurance trade-off
Once the payment fits, the Down Payment Calculator and the PMI Calculator settle the deposit question. Below 20 percent down, a conventional US loan may require private mortgage insurance. The CFPB PMI explainer says PMI protects the lender, adds loan cost, and can be paid monthly, upfront or both; the actual premium depends on the lender, loan and borrower. Replace any calculator placeholder with the Loan Estimate rather than treating a generic percentage as a quote.
On the $400,000 example, 5 percent down means a $20,000 deposit and a $380,000 loan; the $200 to $300 monthly PMI figure is only an illustrative planning placeholder, not a quote — replace it with the lender's Loan Estimate. At 20 percent down, a conventional US loan generally does not require PMI under the CFPB explanation, but product rules vary. The right choice is not always the bigger deposit — it depends on how long the waiting costs you in rents and price growth versus what the insurance costs monthly. The calculators show both sides so the trade-off is explicit.
Cash-to-close: the cost nobody prices
The deposit is not the cash you need on closing day. The Closing Cost Calculator adds lender fees, title insurance, escrow, transfer taxes and prorated items. Do not treat a generic 2–5% range as a quote: the $14,000 in this example is a clearly labelled 3.5% planning assumption. The CFPB Closing Disclosure explainer tells US buyers to compare closing costs and cash to close with the Loan Estimate; buyers elsewhere should use the equivalent local disclosure and fee schedule. Buyers who forget this arrive at settlement short or raid the emergency fund on the day they most need it.
Debt-to-income: the lender's view
The DTI Calculator shows the two ratios lenders actually run: front-end (housing costs divided by income) and back-end (all debts divided by income). It catches the error the other calculators cannot: the buyer whose income qualifies but whose existing debts do not. A $2,600 housing payment on $10,000 of monthly income is a healthy 26 percent front-end ratio, but if credit cards and a car loan push the back-end past 43 percent, the application fails no matter how good the house is.
The order that prevents self-deception
- 1. Affordability at a stressed rate — your true ceiling, before any viewing
- 2. Mortgage payment at the quoted rate — the number you will actually pay
- 3. Deposit versus insurance — the trade-off priced in dollars
- 4. Closing costs — the cash-to-close, not just the deposit
- 5. Debt-to-income — whether the lender will agree with your math
Run the affordability pass twice: once at the quoted rate and once at the rate plus two points. If the payment survives both with a reserve intact, you are buying within your means; if it only survives the quoted rate, you are buying at the edge of a cliff you cannot see. That single habit — the stressed-rate check — is the difference between buyers who sleep through a rate rise and buyers who cannot.
Common mistakes to avoid
- Ignoring property tax and insurance — a $2,022 payment becomes $2,439 once they are included
- Using the asking price instead of your offer price in every calculation
- Forgetting closing costs and arriving at settlement short of cash
- Testing only the quoted rate and never the stressed one
- Buying with no reserve — the boiler, the roof, and the job market do not wait
What the numbers buy you in negotiation
Running the numbers before viewings is not just self-protection; it is negotiation leverage. A buyer who knows their ceiling, their cash-to-close, and their stressed payment can walk away from an overpriced home without a moment's doubt, and can bid with confidence up to a number they have already stress-tested. Sellers and agents feel the difference between a buyer who is pre-approved and a buyer who is pre-decided. Every calculator on this site is free, runs in your browser, and takes minutes — the cost of not running them is measured in decades of payments.
Worked example: one full sequence
Here is the whole sequence on one purchase, so you can see how the calculators connect. Take the $360,000 home that the affordability pass supported for our $120,000-income household, bought with 20 percent down — $72,000. The loan is $288,000; at 6.5 percent over 30 years the principal and interest come to about $1,821 a month. Add property tax at roughly 1.2 percent of value ($360 a month) and insurance ($80), and the full payment is about $2,261.
That $2,261 fits inside the $2,600 housing allowance we calculated, and the debt-to-income check confirms it: housing is 22.6 percent of the $10,000 monthly income (front-end), and with the $1,000 of existing debts it is 32.6 percent back-end — comfortably under the 43 percent ceiling. Closing costs at 3 percent add $10,800, so cash-to-close is about $82,800, and because the deposit is 20 percent there is no PMI. Five calculators, one coherent answer: the purchase may fit the stated assumptions, but no calculator can promise lender approval. The stressed version — about $2,654 a month at 8.5 percent — just overruns the $2,600 allowance, which is itself a useful finding: this buyer has a comfortable deal, but no room for a shock, so the offer price is the ceiling, not the starting point.
| Check | Illustrative result | Decision use |
|---|---|---|
| Quoted PITI | $2,439.28/month | Compare with the household budget |
| Stressed PITI | $2,877.18/month at 8.5% | Shows the payment after a +2-point rate stress |
| Housing allowance | $2,600/month | 36% back-end allowance after $1,000 existing debt |
| 20% deposit + closing costs | $94,000 cash-to-close | $80,000 deposit plus $14,000 illustrative costs |
| Stress result | Stressed PITI exceeds allowance | Lower price, reduce obligations or wait; do not stretch the budget |
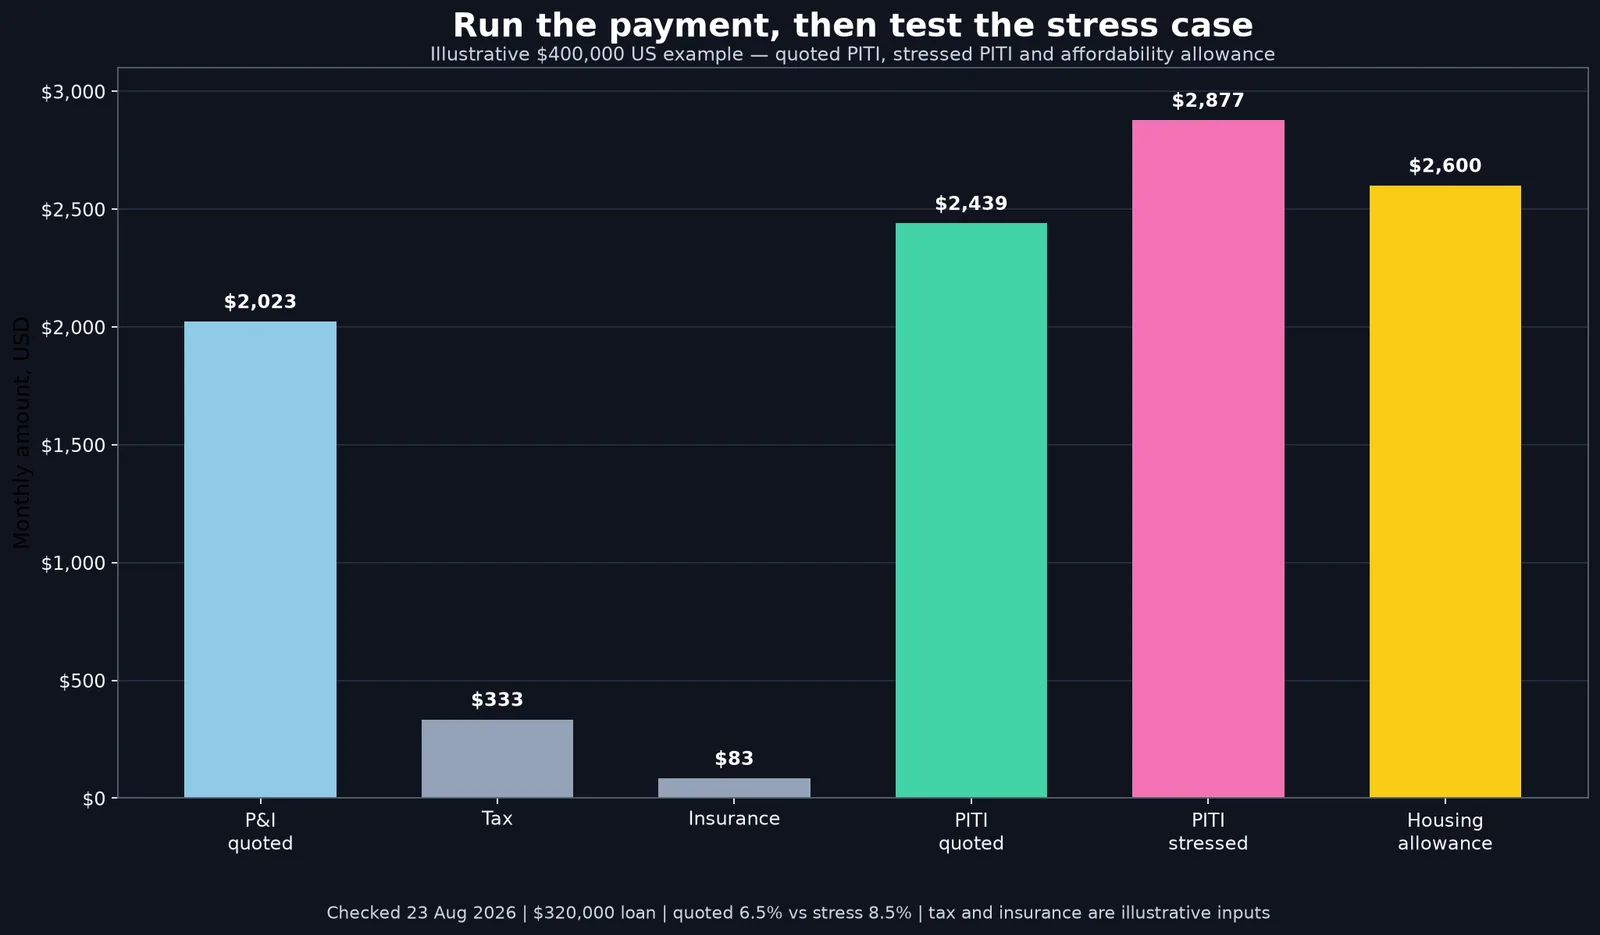
Figure text alternative: quoted principal and interest is $2,022.62; adding $333.33 monthly tax and $83.33 insurance gives quoted PITI of $2,439.28. At 8.5% on the same 30-year $320,000 loan, stressed PITI is $2,877.18, above the illustrative $2,600 housing allowance. This is a planning signal, not a credit approval or affordability guarantee.
Rent versus buy — the calculator most buyers skip
Before you commit to the buying sequence at all, the Rent vs Buy Calculator answers the question the others assume away: is buying even cheaper than renting over your horizon? In the worked example, renting at $1,800 a month is cheaper than the $2,261 ownership payment — but the comparison only looks fair for the first few years. The mortgage builds principal, the property can appreciate, and rents rise, while closing costs and maintenance are one-time and recurring costs of ownership.
The honest version of the comparison totals every cost on both paths over the years you actually expect to stay — typically five to seven years is where buying overtakes renting in many markets, before you add appreciation. If you might move in three years, the math usually says rent; if you will stay a decade, it usually says buy. The calculator also shows the subtle middle: a home that loses to renting over five years can still win over ten, which is why the horizon — not the monthly payment — is the real input. Run the comparison with your real numbers before you let the emotional pull of ownership make the decision.
When the numbers change: rates and timing
Every input to these calculators moves, and the one that moves the most is the rate. On the $320,000 loan from the earlier example, a one-point rise from 6.5 percent to 7.5 percent adds roughly $215 a month — about $2,600 a year of payment you did not budget. That is why the stressed-rate check is not paranoia: between your pre-approval and your closing, the market can move a full point, and the quoted payment you fell in love with is not the payment you will sign.
Re-run the calculators at three moments: when your income or debts change, every six months in a moving market, and always the day before you make an offer. A rate hold on a pre-approval typically locks your quoted rate for 60 to 90 days — know when it expires, because the calculator is only as current as the rate you type into it. And when a seller accepts your offer, re-run once more with the final numbers, because the payment you agreed to is the payment you will live with.
Using the calculators across countries
If you are buying outside your home country — or comparing two markets — the sequence stays the same but the costs change. The Currency Converter prices the exchange-rate side of the purchase, the Stamp Duty Calculator applies the UK bands or other transfer-tax structures, and the Price Per Area Calculator normalises listings between square feet and square metres. The country hubs on this site keep the deposit norms, transfer taxes, and process for the USA, UK, Canada, Australia, and the UAE on one page each, so a cross-border buyer can run both markets through the same five-step sequence without the local rules changing the method.
How often to re-run the numbers
Set a simple cadence: re-run the affordability and mortgage checks every six months, before any offer, and whenever your income, debts, or the quoted rate changes. Keep a one-page snapshot — your ceiling price, your stressed payment, your cash-to-close, and your DTI — the way a pilot keeps a pre-flight checklist. The buyers who get this right do not find a house and hope the math fits; they know the math cold and let the house fit into it.
The inputs people guess (and why it matters)
The calculators are only as honest as the inputs, and three inputs get guessed more than measured. Property tax is the first: using the asking price times a national average hides the fact that tax rates vary wildly by county — 0.5 percent in one place, 2.5 percent in another — which on a $400,000 home is the difference between $167 and $833 a month, a swing larger than the entire insurance line. Use the county's actual mill rate on the assessed value, not a guess, and the Property Tax Calculator turns it into a monthly number.
Insurance is the second: a default $1,000-a-year figure is fine for a first pass, but a quote takes five minutes and can differ by hundreds a year between carriers and coverage levels. The third is the loan term — the difference between a 30-year and a 15-year term on the same loan is hundreds of dollars a month and tens of thousands of dollars of interest, and the Amortization Schedule Calculator shows exactly where that money goes in each year. Buyers who measure these three inputs get answers they can sign; buyers who guess get answers that look great until the first escrow statement — and the first escrow statement is exactly when a payment that was supposed to be $2,439 quietly becomes $2,650.
The pre-offer checklist
- Ceiling price from the affordability calculator at the stressed rate
- Full PITI payment at the quoted rate, with real tax and insurance
- Deposit decision: what 5% vs 20% costs in PMI and waiting time
- Cash-to-close including closing costs, verified against your bank balance
- Front-end and back-end DTI inside lender limits
- Rent-versus-buy check for your actual horizon
- A reserve of three to six months of the stressed housing cost
Every item on that list is answered in minutes by a free calculator on this site, and none of them requires a mortgage broker or an agent to run. Targeted review of the calculator components found visible labels, keyboard-focusable controls, and an aria-live result region; it found no calculator-specific localStorage/sessionStorage write or API submission in the reviewed files. Do not enter sensitive personal data, check the Privacy Policy, and use the formula, worksheet and downloadable sequence CSV as a fallback if a result is not exposed clearly to assistive technology. One more habit pays off at the negotiation table: price the same home twice — at the list price and at what you believe it is worth — because the difference between the two is exactly the room you have to negotiate, and buyers who know their walk-away number never overpay out of momentum. When the checklist is done, you are not hoping the purchase fits your life — you have tested it, stressed it, and priced it, and the only thing left is to like the house. That is the order that separates buyers who thrive from buyers who survive.
Official guidance and tool-use sources
| Use this source for | Official route | Scope / caution |
|---|---|---|
| US home-buying workflow and disclosures | CFPB Owning a Home | Consumer guidance; actual loan terms and disclosures come from the lender. |
| US mortgage affordability and DTI context | Fannie Mae Selling Guide — DTI ratios | Programme rules are not universal limits; automated underwriting, reserves, credit and lender overlays matter. |
| US mortgage-rate history | Freddie Mac PMMS | Market survey data is not a personal quote and may use a different loan profile. |
| US closing disclosures | CFPB Closing Disclosure | Use the lender's Loan Estimate and Closing Disclosure for the actual transaction. |
| US FHA programme context | HUD FHA loan limits | Loan limits and programme rules can change; verify the relevant year and county. |
This guide is primarily a USD/US workflow. Buyers in the UK, Canada, Australia, UAE or another market should keep the order of questions but replace the inputs and rules with their local regulator, lender, tax authority, insurance quote and closing-cost evidence. The date above is the article check date; source pages and lender criteria can be revised after publication. This article is educational content, not personalised financial, tax or legal advice.
Related reading
Continue reading: The 28/36 Rule: Still Useful in 2026? · Closing Costs Explained for Buyers · Debt-to-Income Ratio for Home Buyers. Run your own numbers with the Free Mortgage Calculator — it takes under a minute and beats guessing.
Frequently asked questions
Which property calculator should I use first?
Start with the Home Affordability Calculator at a stressed rate (quote plus two points) to find your ceiling, then the Mortgage Calculator for the exact payment, the Down Payment and PMI calculators for the deposit trade-off, and the Closing Cost Calculator for cash-to-close.
Are property calculators accurate?
They use standard industry formulas with visible assumptions — tax, insurance, PMI, rates. The numbers are estimates for planning and comparison; your lender's quote, your actual tax bill, and your real insurance premium will differ, and that difference is expected.
What is a good debt-to-income ratio for a mortgage?
In the US, 28% front-end and 36% back-end are common planning benchmarks, and some conventional underwriting paths may permit higher back-end ratios. They are not universal limits or a personal comfort target; confirm the current rule for your loan programme and lender.
Should I stress-test my mortgage at a higher rate?
Yes. Qualify your payment at the quoted rate plus two percentage points. If the payment still fits with a reserve intact, a future rate rise — or a future renewal at higher rates — will not break the budget.
Do I need to use the calculators before viewing homes?
Ideally yes: know your stressed payment, your ceiling price, and your cash-to-close before you see anything. Buyers who calculate first buy what they can carry; buyers who view first tend to retrofit the numbers to a house they already love.
Which calculator should you run first?
Start with the affordability number, because it sets the budget every other calculator depends on. Use the Home Affordability Calculator with your income, debts, and down payment, then move to the Mortgage Calculator to see the exact payment, and finish with the Closing Cost Calculator to model the cash you need at the table. Running them in that order turns a vague 'how much house' question into a concrete price range in about ten minutes.