 By Nirmal Lashkari · Founder · Indore, Madhya Pradesh, India
$1,800 monthly rent, a $400,000 home, $80,000 down, 6.5% interest, a 30-year term, and a 7-year stay, the model estimates buying has the lower net cost: about $107,449 versus $165,509 for renting, so buying looks cheaper. It also estimates $173,101 in net sale proceeds and a $289,332 mortgage balance at sale, assuming 3% rent growth, 3% appreciation, 1% maintenance, and 6% selling costs.
Illustrative comparison
Buying looks cheaper
Total cost of renting (7 yrs): $165,509.18
Assumes 3% annual rent growth, 3% appreciation, 1% maintenance, and selling costs entered above. It excludes property tax, insurance, income-tax effects, and transaction-specific costs unless you incorporate them separately.

A rent-versus-buy result is a time-bounded cost comparison, not a universal verdict about housing. This calculator places your current monthly rent beside a purchase financed with the home price, down payment, interest rate, and loan term you enter. It then follows both paths for the number of years you expect to stay. Renting accumulates rent payments; buying accumulates the modeled ownership cost and leaves a potential sale value after the remaining mortgage and selling costs are deducted.
That distinction matters because a mortgage payment is not identical to rent. Part of a mortgage payment reduces the outstanding loan and can return as equity when the property is sold. Ownership also carries maintenance and a sale-cost haircut. The component labels its conclusion as “Renting looks cheaper,” “Buying looks cheaper,” or “Costs are similar,” so read the label as the output of these assumptions rather than as a prediction of your future.
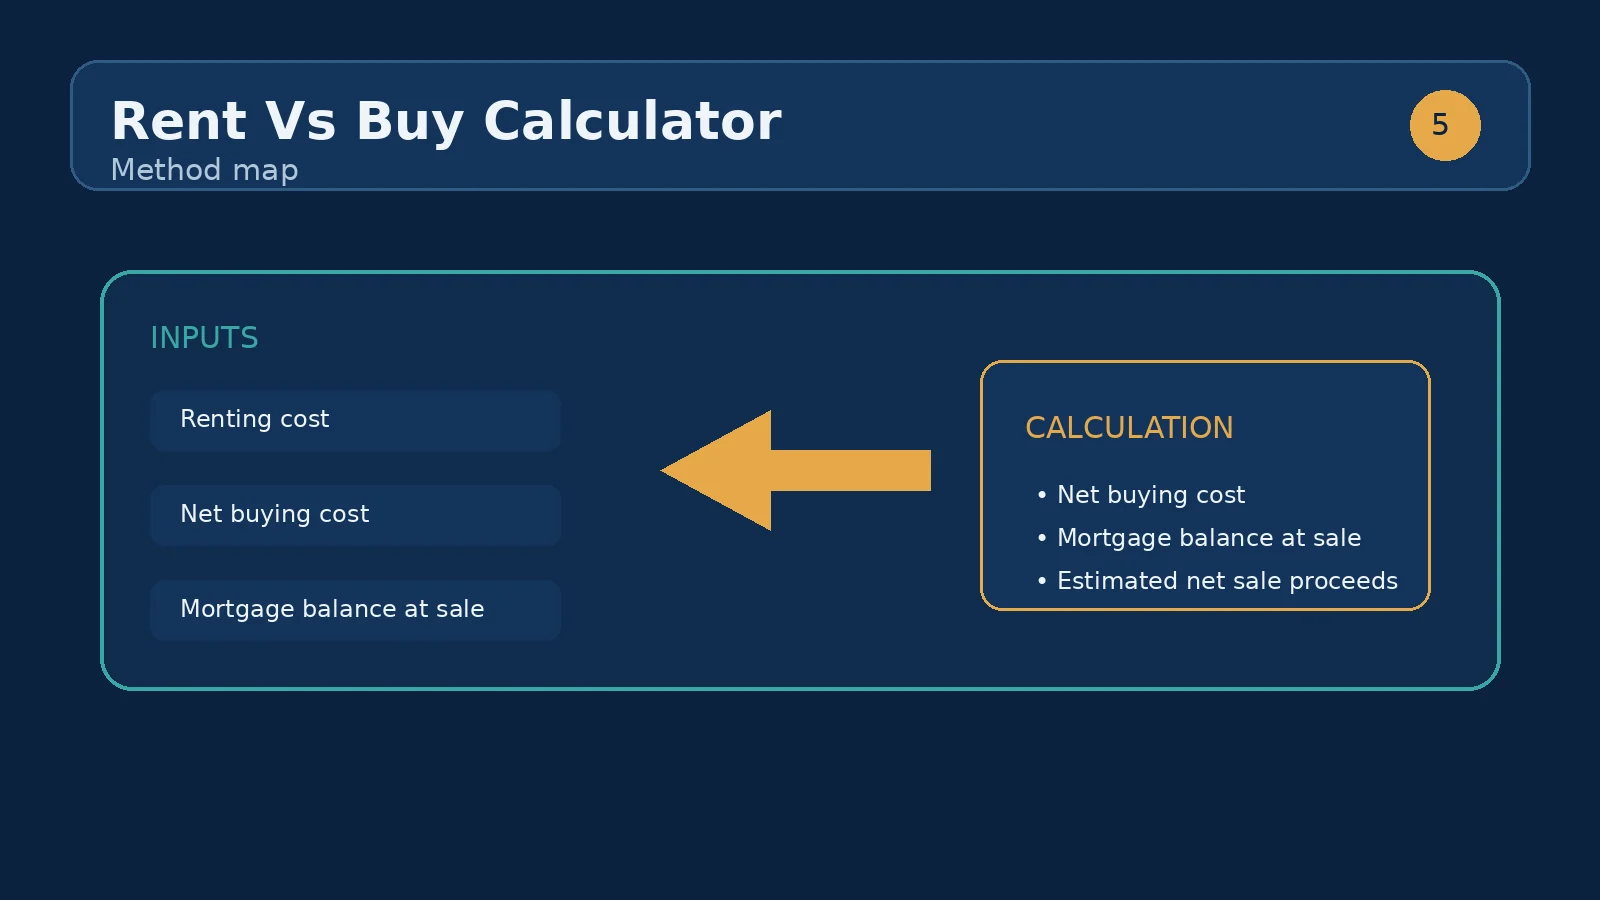
Current monthly rent is the starting monthly payment for the renting path. The calculation also applies a fixed 3% annual rent-growth assumption inside the component, so the first-year rent is not the same as the final-year rent. Home price and down payment determine the initial loan: with a $400,000 home and an $80,000 down payment, the modeled mortgage principal is $320,000.
Interest rate is entered as an annual percentage and term is entered in years. Together they shape the amortizing mortgage and the balance remaining when the modeled sale occurs. Years you plan to stay is especially important: a three-year stay and a seven-year stay can produce different outcomes even when every other field is unchanged. Estimated selling costs is a percentage deducted from the eventual sale value; the field accepts values from 0% through 15%.
Several assumptions are fixed rather than editable in this component. Annual rent growth is 3%, annual home appreciation is 3%, and annual maintenance is 1% of the home price. Those values are scenario settings, not promises about a particular market, property, or future year. The calculator also excludes property tax, homeowners insurance, income-tax effects, and transaction-specific costs unless you incorporate them separately in your own review.
Because the same 3% rate is used for rent growth and home appreciation, the result is most sensitive to financing, the length of the stay, the sale-cost percentage, and the gap between starting rent and ownership cost. A result that changes when you move the stay length from seven years to four years is telling you that time is doing substantial work. A result that changes when selling costs rise from 4% to 6% is telling you the exit friction matters.
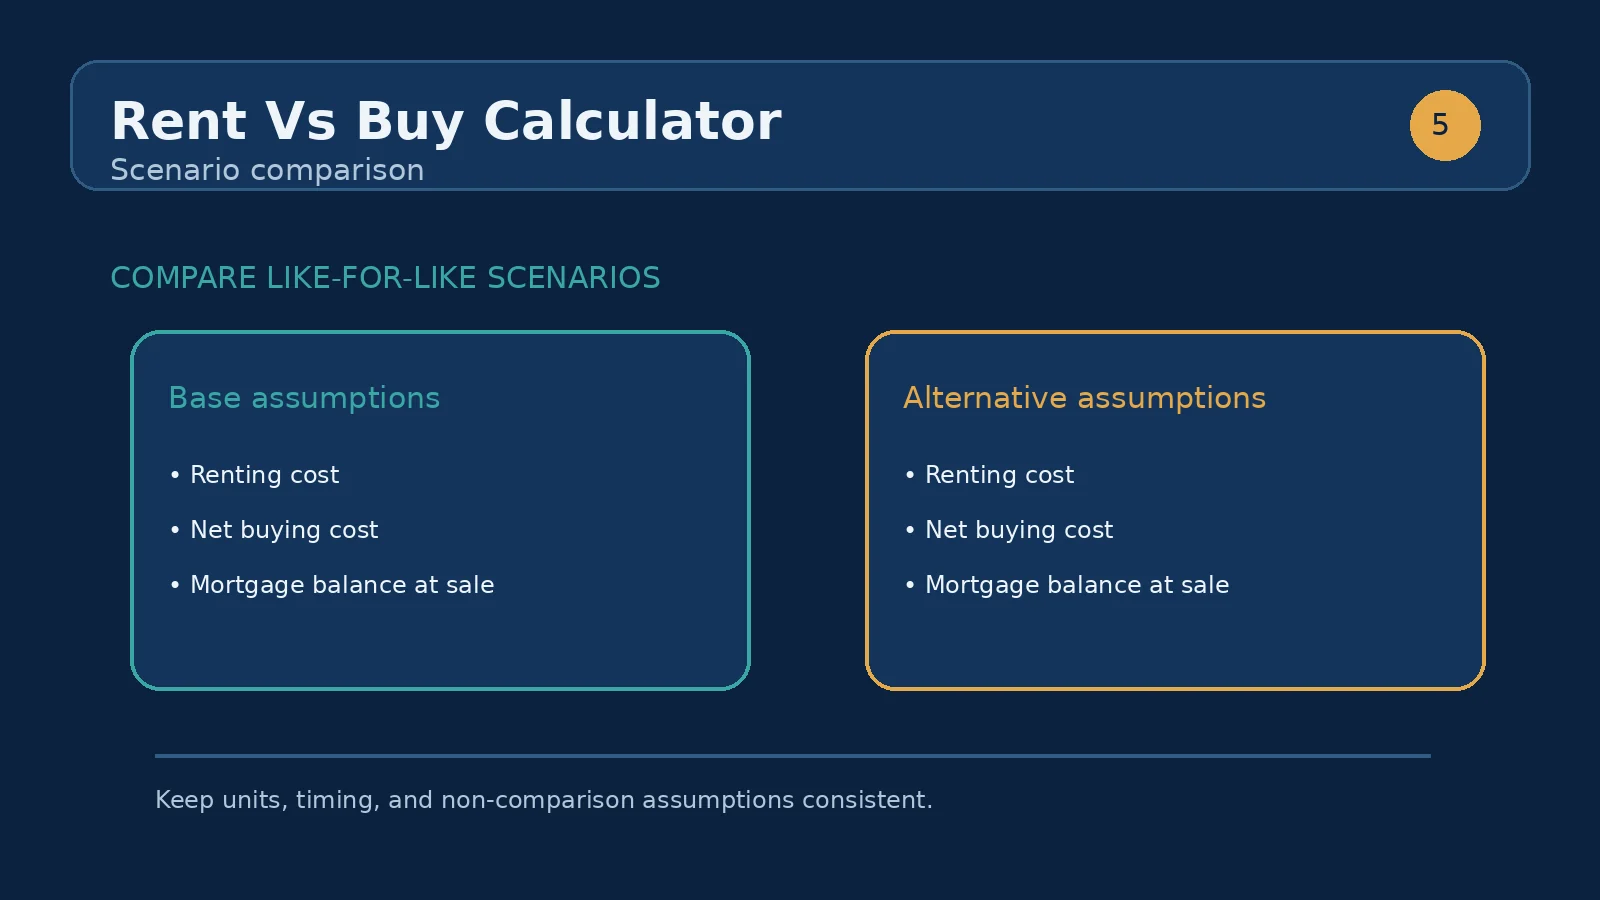
Total cost of renting is the accumulated rent over the entered stay, including the component’s 3% annual rent-growth assumption. It is a cash-outflow measure: it does not create a sale asset. Net cost of buying is the modeled ownership cost after accounting for the purchase path and its modeled residual value. Compare these two figures first, then inspect the sale outputs rather than treating the recommendation label as sufficient.
Estimated net sale proceeds are the amount expected to remain from the appreciated home after the entered selling-cost percentage and the mortgage balance are considered. Mortgage balance at sale is the unpaid loan principal at the end of the stay. A large sale proceeds figure is not the same as profit: it includes the return of your remaining equity and is only realized if you sell at the assumed value and pay the modeled exit cost. If the stay ends before the mortgage has amortized much, the balance can remain substantial.
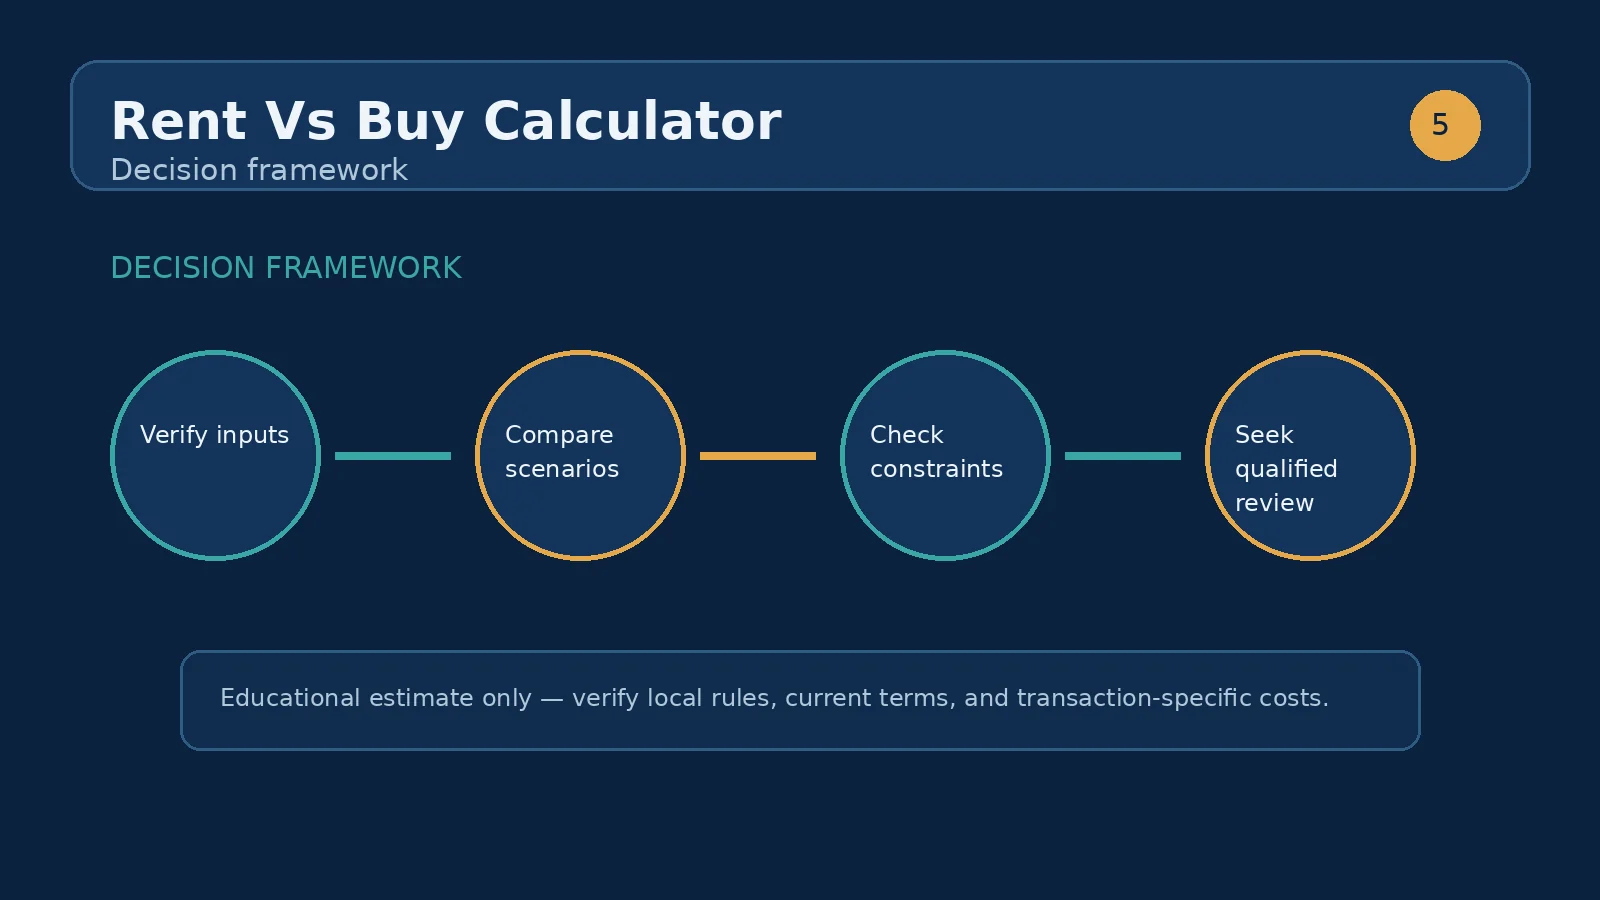
Start with the visible defaults: $1,800 monthly rent, a $400,000 home, an $80,000 down payment, a 6.5% annual rate, a 30-year term, and a seven-year stay. The initial loan is $320,000. The calculator applies 3% annual rent growth, 3% annual appreciation, 1% annual maintenance, and 6% selling costs. This is a factual illustration of what the component models, not a claim about what a particular home will earn or cost.
After calculating, record the recommendation and all four displayed amounts. Then rerun the exact scenario with four years to stay, and again with ten years. The point is not to select the longest horizon because it produces the more attractive answer; it is to see whether your conclusion depends on remaining in the home. Next, keep the seven-year stay and change only selling costs from 6% to 3%. If the recommendation flips, the sale-cost assumption deserves careful attention before you rely on the comparison.
The tool is easiest to use when you separate the two choices into their economic mechanics. Renting offers a known starting payment and preserves the down payment for other uses, while the model allows rent to grow annually. Buying converts the down payment into home equity, reduces the loan through amortization, and exposes you to maintenance and selling costs. Neither row is automatically the better life choice; the table explains what to investigate next.
The most common mistake is entering a mortgage rate or home price that is attractive but not plausible for the intended purchase. A second is choosing years to stay based on the loan term rather than the likely time before moving. A 30-year mortgage does not mean you will own the property for 30 years; the calculator needs your expected holding period because the sale and remaining balance happen at that point.
Another mistake is reading net sale proceeds as a cash gift, ignoring the mortgage balance, or treating the recommendation as a guarantee. Users also overlook that the component excludes property tax, insurance, income-tax effects, and transaction-specific costs. Finally, changing several inputs at once makes it impossible to identify the driver. Change one field, rerun the scenario, and write down what changed in the four outputs.
A useful conclusion is conditional: buying looks cheaper if you stay for this period, the home follows the modeled appreciation path, maintenance is near the assumption, and the sale costs resemble the entered percentage. Renting looks cheaper if the shorter horizon, financing cost, or exit haircut overwhelms the equity created by ownership. When the two net costs are close, the honest output is uncertainty rather than false precision.
After reviewing this calculator, a natural next step is the home-affordability calculator. Use it to test whether the home price and down payment fit a broader monthly budget before treating a favorable rent-versus-buy result as actionable. If the purchase only works at a price that strains cash reserves, the comparison has identified a theoretical advantage rather than a comfortable plan. Pair the numeric result with liquidity, mobility, maintenance capacity, and the possibility that you will not sell at the assumed time or value.
Buying has high upfront costs, so the longer you stay, the more likely buying beats renting as those costs are spread out and equity builds.
Yes — usually over short stays. Upfront purchase costs and selling costs have little time to be recovered, while rent builds no equity. On the default example with a 7-year stay, buying is the lower net cost at roughly $107,449 versus $165,509 for renting; shorten the stay and the gap narrows or flips.
The model counts the down payment, monthly mortgage payments, maintenance at 1% of value a year, and selling costs of 6%, then subtracts the projected net sale proceeds. On the defaults those proceeds are about $173,101 against a remaining mortgage balance of $289,332.
Rent only, growing at the rent-growth assumption — 3% a year on the defaults. It does not credit the renter for investing the money not spent on a deposit, so treat the comparison as a direct cost tally rather than a full financial plan.
Each extra year spreads the fixed costs of buying over more time and adds a year of equity, so longer horizons increasingly favor buying. Run the same numbers at 3, 5, and 10 years to see where the crossover sits for your market.
No. The mortgage payment includes principal reduction, while rent does not create home equity. Compare the calculator’s total rent cost, net buying cost, estimated net sale proceeds, and mortgage balance for the same stay period.
The stay length determines how many rent increases and ownership costs are counted, how much the mortgage balance falls, how much appreciation is modeled, and when selling costs are deducted. Short stays give less time for those ownership effects to offset purchase and exit friction.
It is a fixed illustrative assumption implemented by the component. It is not a forecast, a market claim, or a guarantee that the home will be worth more when you sell. Test the result as a scenario and avoid relying on one growth case.
No. The component explicitly notes that property tax, insurance, income-tax effects, and transaction-specific costs are excluded unless you incorporate them separately. Add those costs to your own comparison before making a commitment.
It is the modeled residual value after applying the appreciation assumption, deducting the entered selling-cost percentage, and accounting for the outstanding mortgage balance. It is not the same as gross sale price or guaranteed profit.
Keep the rent, price, rate, and term fixed while testing several stay lengths. Then change selling costs and review the default scenario against a more conservative case. If small changes reverse the recommendation, treat the result as financially close and investigate non-cost factors carefully.
Usually not. Term is the scheduled length of the loan, while years you plan to stay is the period before the modeled sale. Enter the likely holding period separately; a seven-year stay can occur with a 30-year mortgage.
Price-to-rent ratio explained: what a high or low ratio signals about a market, and how to use it in a rent-vs-buy decision.
A simple rent vs buy decision framework: compare renting and buying costs over your actual holding period, including sale costs, and find the year.
How we calculate: calcRentVsBuy in calculators.ts; regression checks in calculators.test.ts
Last reviewed: . Learn more about Nirmal Lashkari and LashkariProperties.
Disclaimer: This calculator provides estimates for informational purposes only and is not financial, tax, or legal advice. Verify figures with a qualified professional before making decisions.
