 By Nirmal Lashkari · Founder · Indore, Madhya Pradesh, India
$350,000 property earning $1,800 per month with $4,000 in annual expenses produces an estimated net rental yield of 5.03%, a gross rental yield of 6.17%, and annual rent of $21,600. Net yield subtracts annual expenses from annual rent before dividing by property value, while gross yield uses annual rent alone.
Maintenance, taxes, insurance, management, vacancy.
Net rental yield: 5.03%
The yield waterfall
6.17% gross → −18.52% costs → 5.03% net. You keep 81.48% of every rent dollar before financing.

Rental yield is an income percentage: the rent a property produces in a year compared with the property's value. This calculator shows two views of that relationship. Gross rental yield uses annual rent before the entered annual expenses. Net rental yield subtracts those annual expenses first, so it gives a more cautious view of the income left after the costs represented in the form.
The distinction matters because a property can look attractive on gross income while becoming ordinary after maintenance, taxes, insurance, and management are paid. The component labels those four categories in the annual-expenses hint, but the single number is deliberately flexible: enter the recurring annual costs you want included and use the same definition when comparing another property. The result is a screening measure, not a promise of profit, appreciation, occupancy, or resale value.
The calculator also reports annual rent as a separate output. That makes the percentage easier to audit. If annual rent does not equal monthly rent multiplied by twelve, or if a yield seems inconsistent with the value and expenses you entered, inspect the inputs before drawing a conclusion. A transparent calculation is more useful than a precise-looking percentage whose assumptions are hidden.
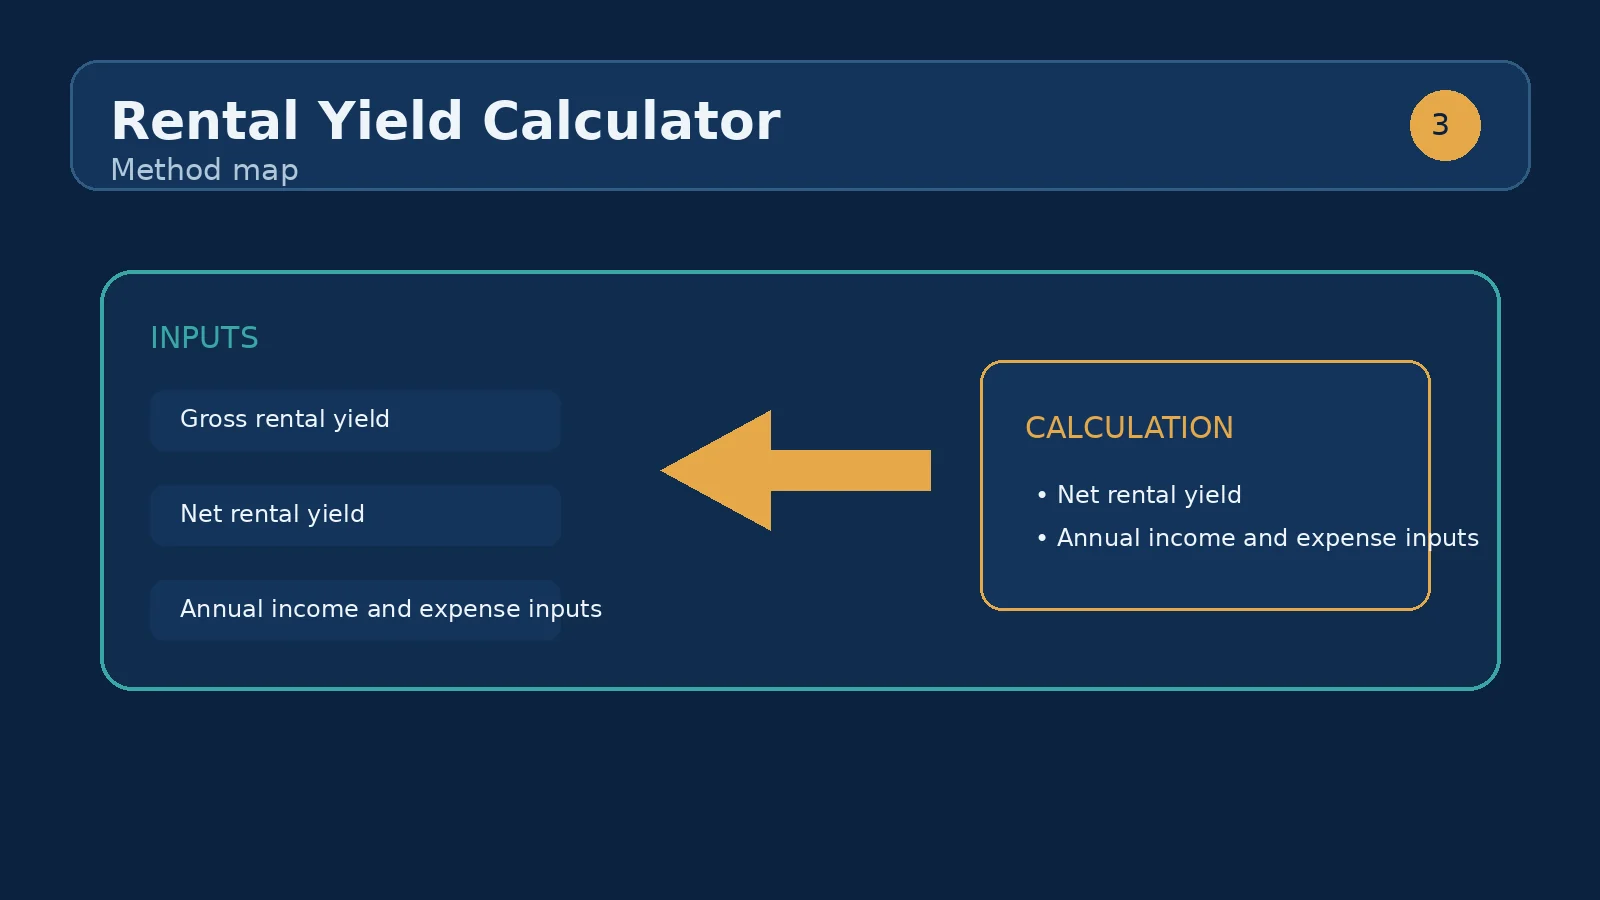
Property value is the denominator used by both yield outputs. For a purchase decision, that should normally be the price or total basis you have chosen to compare, rather than an optimistic future valuation. Monthly rent is the recurring monthly income assumption. The calculator annualises it, so a rent of $1,800 becomes $21,600 of annual rent. Annual expenses is the yearly amount you want removed from rent before net yield is calculated; the form specifically points to maintenance, taxes, insurance, and management.
In formula form, annual rent equals monthly rent times twelve. Gross yield percent equals annual rent divided by property value, multiplied by 100. Net income in this tool equals annual rent minus annual expenses, and net yield percent equals that net income divided by property value, multiplied by 100. Because property value must be positive for a meaningful denominator, enter zero only while setting up the form, not as an investment comparison.
These inputs are intentionally narrower than a full property model. There is no separate vacancy field, loan balance, interest rate, purchase-cost field, tax treatment, capital-improvement schedule, or sale assumption in the visible component. If one of those items matters to your decision, reflect a recurring or expected cost in annual expenses where that is analytically appropriate, then move to a more detailed tool rather than pretending this snapshot answers the missing question.
Use the component's displayed starting values as a factual example: property value $350,000, monthly rent $1,800, and annual expenses $4,000. Annual rent is $1,800 multiplied by twelve, or $21,600. Gross rental yield is $21,600 divided by $350,000, multiplied by 100, which is approximately 6.17 percent. Net income after the entered expenses is $21,600 minus $4,000, or $17,600. Net rental yield is therefore approximately 5.03 percent.
The gap between the two outputs is about 1.14 percentage points. It is not an error; it is the income effect of the $4,000 expense assumption divided by the same $350,000 value. If you change annual expenses to $6,000 while leaving rent and value unchanged, annual rent remains $21,600 and gross yield remains approximately 6.17 percent, but net income falls to $15,600 and net yield falls to approximately 4.46 percent.
This example also shows why the annual-rent output belongs beside the percentages. A reader can reproduce both yields from $21,600, $17,600, and $350,000. If the property value changes to $400,000 without changing rent or costs, the income dollars do not change, but both yields decline because the same income is being measured against a larger value.
Gross yield is useful for a fast first pass. It answers, “How large is the annual rent relative to value before the expenses entered here?” Because it ignores the annual-expenses input, two properties with identical value and rent have identical gross yield even if one has materially higher maintenance or management costs. That makes gross yield quick, but also easy to overread.
Net yield is the better comparison when the cost assumptions are consistent. In the worked scenario, gross yield is approximately 6.17 percent and net yield approximately 5.03 percent. The net figure recognises the $4,000 annual expense allowance, while still remaining limited to what that allowance captures. It does not automatically account for every possible irregular outflow, and it does not become a forecast merely because it is labelled net.
When comparing listings, place value, monthly rent, and annual expenses into the same worksheet or repeatable process. Do not compare one property's gross yield with another property's net yield. Also avoid comparing a carefully costed property with a headline listing whose rent is unverified. A lower but well-supported net yield can be more decision-useful than a higher percentage built on a fragile rent assumption.
Start with the categories named by the component: maintenance, taxes, insurance, and management. Gather the best available annual amounts for the property and add them. If a cost is billed monthly, multiply the monthly amount by twelve before entering it. If it is billed annually, enter the annual figure directly. Keep a note of what is included so that a later comparison does not silently use a different definition of net.
A recurring allowance is often more useful than a single unusually quiet year. Maintenance can be lumpy: a property may have modest spending for several months and then require a substantial repair. The calculator accepts one annual total, so use an assumption that represents the period you are trying to screen rather than choosing the smallest recent bill simply to improve the yield. If you do not yet know a cost, mark the uncertainty outside the form and test more than one expense case.
Vacancy and turnover deserve special care. They are not separate visible inputs. If you expect an empty period, you can model its lost rent outside the calculator or convert it into an annual income assumption before using the tool, but do not hide a major uncertainty and call the resulting percentage a complete net yield. Debt service is also not a visible input; use the Rental Cash Flow Calculator next when the question is whether rent covers financing and monthly operating cash needs.
The first mistake is entering weekly, quarterly, or annual rent into the monthly-rent field. The label is explicit: the field expects a monthly amount. A second is entering a purchase price in one comparison and a post-renovation value in another. Since value is the denominator, that choice can move the percentage substantially while leaving income unchanged.
A third mistake is setting annual expenses to zero because the owner plans to self-manage. Self-management may remove a management fee, but it does not remove maintenance, taxes, insurance, or the value of the owner's time. A fourth is using a peak rent without checking whether it is the stable rent assumption relevant to the holding period. The calculator will faithfully calculate an optimistic input; it cannot validate the input for you.
Finally, do not treat net yield as total investment return. The component does not model financing, principal reduction, capital appreciation, sale costs, or one-off purchase costs. It also does not establish that rent will be collected every month. Use the displayed result to identify questions, compare like-for-like assumptions, and decide which deeper calculation should follow.
Each input has a predictable directional effect. Increasing monthly rent raises annual rent, gross yield, and net yield when value and expenses stay fixed. Increasing annual expenses leaves annual rent and gross yield unchanged but lowers net income and net yield. Increasing property value lowers both yield percentages when rent and expenses stay fixed. These relationships are useful for sensitivity checks because they let you explain a movement rather than merely observe it.
Try a small table of cases rather than relying on one point estimate. For the starting example, keep value at $350,000 and compare monthly rent of $1,600, $1,800, and $2,000 with the same $4,000 annual expenses. Annual rent becomes $19,200, $21,600, and $24,000; gross yield becomes approximately 5.49, 6.17, and 6.86 percent; net yield becomes approximately 4.34, 5.03, and 5.71 percent. The arithmetic exposes how much the conclusion depends on rent.
Then stress costs. At $1,800 monthly rent and $350,000 value, annual expenses of $2,000, $4,000, and $6,000 produce net yields of approximately 5.60, 5.03, and 4.46 percent. A result that remains acceptable across reasonable cases is more robust than one that works only at the most favourable rent and expense combination.
A high percentage is not automatically a high-quality property. It may reflect a low value, unusually high rent, deferred maintenance, tenant-demand risk, or costs that have not yet been identified. Conversely, a lower yield may accompany a property with steadier demand or fewer operational surprises. This calculator does not score those risks, so the percentage should start a diligence conversation rather than end one.
Financing creates another distinction. Net yield compares property income with property value; it does not tell you whether the monthly cash position is positive after interest, principal, and financing fees. A property can have a respectable net yield and still require monthly cash from the owner when debt service is high. If a loan is part of the plan, enter the same rent and cost assumptions into the Rental Cash Flow Calculator and inspect the cash result separately.
For an unlevered income comparison, the Cap Rate Calculator may be the next sibling tool to use, provided its denominator and expense definitions match. For a detailed financed case, follow with rental cash flow and, where relevant, a debt-service coverage analysis. Keeping each tool's question distinct prevents a yield percentage from being mistaken for a complete return forecast.
First, write down the value basis and confirm that every property uses the same basis. Second, enter a realistic monthly rent, not merely the highest advertised figure. Third, assemble annual expenses using the categories named by the form and document exclusions. Fourth, record annual rent, gross yield, and net yield exactly as displayed. Fifth, repeat the process under a conservative rent case and a higher-expense case.
Next, compare the net-yield spread with the reason for the spread. If one property leads only because its expenses are understated, the ranking is not meaningful. If it leads after consistent assumptions, investigate whether the difference is compensation for location, condition, tenant profile, or management complexity. The calculator cannot answer those qualitative questions, but it gives you a common quantitative starting point.
Finally, move the leading candidates into the next sibling calculation. Use Rental Cash Flow Calculator when financing, vacancy, or monthly cash needs matter. Use Cap Rate Calculator when you want a broader unlevered operating-income comparison. The right next step is not to force more assumptions into this simple form; it is to carry the documented assumptions into the tool designed for the next question.
It depends on the market, but many investors target a net yield that comfortably exceeds financing and holding costs. Compare against local benchmarks.
Gross yield is annual rent divided by property value. Net yield subtracts annual expenses from rent first. On the default example, $1,800 a month is $21,600 of annual rent on a $350,000 property — 6.17% gross, or 5.03% net after $4,000 of expenses.
Multiply the property value by the target yield and divide by 12. A 6% gross yield on a $350,000 property requires $21,000 of annual rent, or $1,750 a month — the default example's $1,800 rent produces 6.17%.
The market presets set annual expenses as a share of gross rent: 30% for a typical US single-family rental, 28% for UK buy-to-let, 26% for Canada, and 24% for Australia. Pick the closest preset as a starting point, then replace it with actual figures as you gather them.
Both divide income by property value and neither includes mortgage payments. Net yield here is based only on the expenses you enter, while cap rate is conventionally built from a fuller net operating income. Use the cap rate calculator when you want the standard unlevered comparison between properties.
Gross yield compares annual rent with property value before the entered annual expenses. Net yield subtracts annual expenses first, then compares the remaining income with property value.
The component accepts monthly rent and reports its annualised equivalent, so the annual-rent output is monthly rent multiplied by twelve.
Use the recurring annual costs you want deducted from rent, including the component's named examples: maintenance, taxes, insurance, and management. Keep the definition consistent across comparisons.
There is no separate vacancy input in the visible component. Model expected lost rent separately or use a more detailed rental cash-flow tool when vacancy is central to the decision.
No. The component has no loan or debt-service input. Use rental cash flow separately to assess income after financing costs.
Use the value basis that matches the comparison you are making and apply it consistently. For a purchase screen, document whether the figure is price alone or an all-in basis.
Net yield is based on annual rent minus annual expenses. Increasing expenses reduces net income while leaving property value unchanged, so net yield falls.
Stress the rent and expense assumptions, then use the Rental Cash Flow Calculator for financed monthly cash flow or the Cap Rate Calculator for a broader unlevered comparison.
Yes. The percentage does not measure condition, tenant demand, vacancy, liquidity, capital work, or financing risk. Investigate why the yield is high before treating it as an advantage.
Gross and net yields are only comparable when the numerator, denominator, rent period, and expense treatment are consistent. Mixing definitions can make one property look better without a real economic difference.
Capital gains on property sales: how the gain is computed, the US primary-residence exclusion, UK and Canada rates, Australia's 50% discount, and a worked.
How landlords calculate net yield: the expense list that separates net from gross, vacancy and management math, and why net yield is not the whole story.
A practical, math-driven playbook to move a rental DSCR from 1.10 to 1.25 — worked scenarios, lender rules, decision framework, and a live calculator.
How we calculate: calcRentalYield in calculators.ts; regression checks in calculators.test.ts
Last reviewed: . Learn more about Nirmal Lashkari and LashkariProperties.
Disclaimer: This calculator provides estimates for informational purposes only and is not financial, tax, or legal advice. Verify figures with a qualified professional before making decisions.
