

Net yield is the operating return a rental property produces before financing and income tax. Gross yield — annual rent divided by price — can look attractive while the property quietly loses cash every month once taxes, insurance, management, repairs, and vacancy are subtracted. This guide walks through the exact expense list that separates the two, with a full worked example, and then explains why net yield is still not the same as cash-on-cash return.
At a glance: the answer in 60 seconds
- Formula: net yield = net operating income (rent minus operating costs) ÷ property value or purchase price. Mortgage payments are not operating costs, so test them separately in cash-on-cash analysis.
- In the worked USD example below, $28,800 gross rent becomes $16,776 net operating income after $12,024 of operating costs: 8.2% gross yield becomes 4.8% net yield.
- Stress vacancy, repairs, management and insurance upward before making an offer; a property that works only at perfect occupancy is not a resilient investment case.
- These are educational calculations, not investment, tax or legal advice. Use current local rents, prices, taxes, insurance quotes and financing terms for a real property.
Disclosure and scope
LashkariProperties is an educational real-estate publisher, not a licensed financial adviser, tax professional or lawyer. The examples are illustrative planning math, not a recommendation to buy, sell or borrow. Rental rules, taxes, insurance, lending rates, vacancy and local charges vary by country, state, province, property type and taxpayer. Confirm consequential decisions with current official sources and a qualified local professional.
Gross yield first, because it is the headline
Gross yield is annual rent divided by the property value. A $350,000 property renting for $2,400 a month produces $28,800 a year, so the gross yield is 8.2 percent. It is a useful screening number — it lets you compare markets without a spreadsheet — but it ignores every cost of ownership, which is exactly why a gross yield of 8 percent can coexist with a property that loses money.
The Rental Yield Calculator computes both gross and net in one pass, so the gap between them is visible immediately rather than discovered on a tax return two years later.
The net yield expense list
Net yield subtracts the annual operating costs from the rent before dividing by the value. The list every landlord should use: property taxes, insurance, property management, vacancy, repairs and maintenance, HOA or condominium fees, and utilities if you pay any. The 8–10% management, 5–8% vacancy and 5–10% repairs figures used below are planning assumptions, not universal market facts; adjust them for single-family versus multifamily, furnished versus unfurnished, short-term versus long-term, climate, age, local regulation and self-management. What you do not subtract is the mortgage — mortgage interest is a financing cost, not an operating cost, and it belongs in cash-flow analysis rather than yield.
On the $350,000 illustrative US-style example: taxes at 1.2 percent of value are $4,200 a year, insurance is $1,200, management at 9 percent of rent is $2,592, vacancy at 6 percent is $1,728, and repairs at 8 percent are $2,304. Total operating costs: $12,024 a year. Net operating income is $28,800 minus $12,024, or $16,776, so the net yield is 4.8 percent — a very different number from the 8.2 percent gross. The rate and expense percentages are assumptions for teaching, not current quotes.
How to localize the planning assumptions
- Long-term, self-managed homes may have no management percentage but still carry an explicit time cost; professional management often adds a collected-rent fee plus leasing or renewal charges.
- Furnished or short-term rentals usually need a larger turnover and repair reserve than a stable unfurnished tenancy; ask for local cleaning, re-letting and maintenance quotes rather than importing the example percentages.
- Older buildings or properties exposed to storms, flooding, extreme heat or cold need a property-specific reserve review; inspect the roof, HVAC, plumbing, envelope and insurance exclusions before choosing a repair percentage.
- Use the example only as a starting case: replace every percentage with evidence from the exact property, lease type and jurisdiction before making an offer.
Worked example — United States (USD)
| Line item | Annual calculation | USD result | Assumption / decision note |
|---|---|---|---|
| Gross rent | $2,400 × 12 months | $28,800 | Illustrative US-style rent; replace with a signed lease or local rent evidence. |
| Property taxes | 1.2% × $350,000 | $4,200 | Planning assumption; verify the actual assessor bill and reassessment rules. |
| Insurance | Annual policy estimate | $1,200 | Planning assumption; obtain a current landlord-policy quote. |
| Management | 9% × $28,800 | $2,592 | Planning assumption; confirm fee, leasing fee, renewals and maintenance mark-ups. |
| Vacancy | 6% × $28,800 | $1,728 | Planning assumption; model turnover days, concessions and re-letting costs. |
| Repairs | 8% × $28,800 | $2,304 | Planning assumption; older buildings, weather and furnished lets may need more. |
| Net operating income | $28,800 − $12,024 | $16,776 | Operating result before mortgage, income tax, depreciation and capital expenditure. |
| Net yield | $16,776 ÷ $350,000 | 4.8% | Compare only with another property using the same denominator and cost definition. |
Table 1 provenance and method: this is a reproducible illustrative worksheet, not a local market dataset. The input units, formulas, assumption notes and exact results are available in the Net Yield worked-example CSV; checked 23 August 2026.
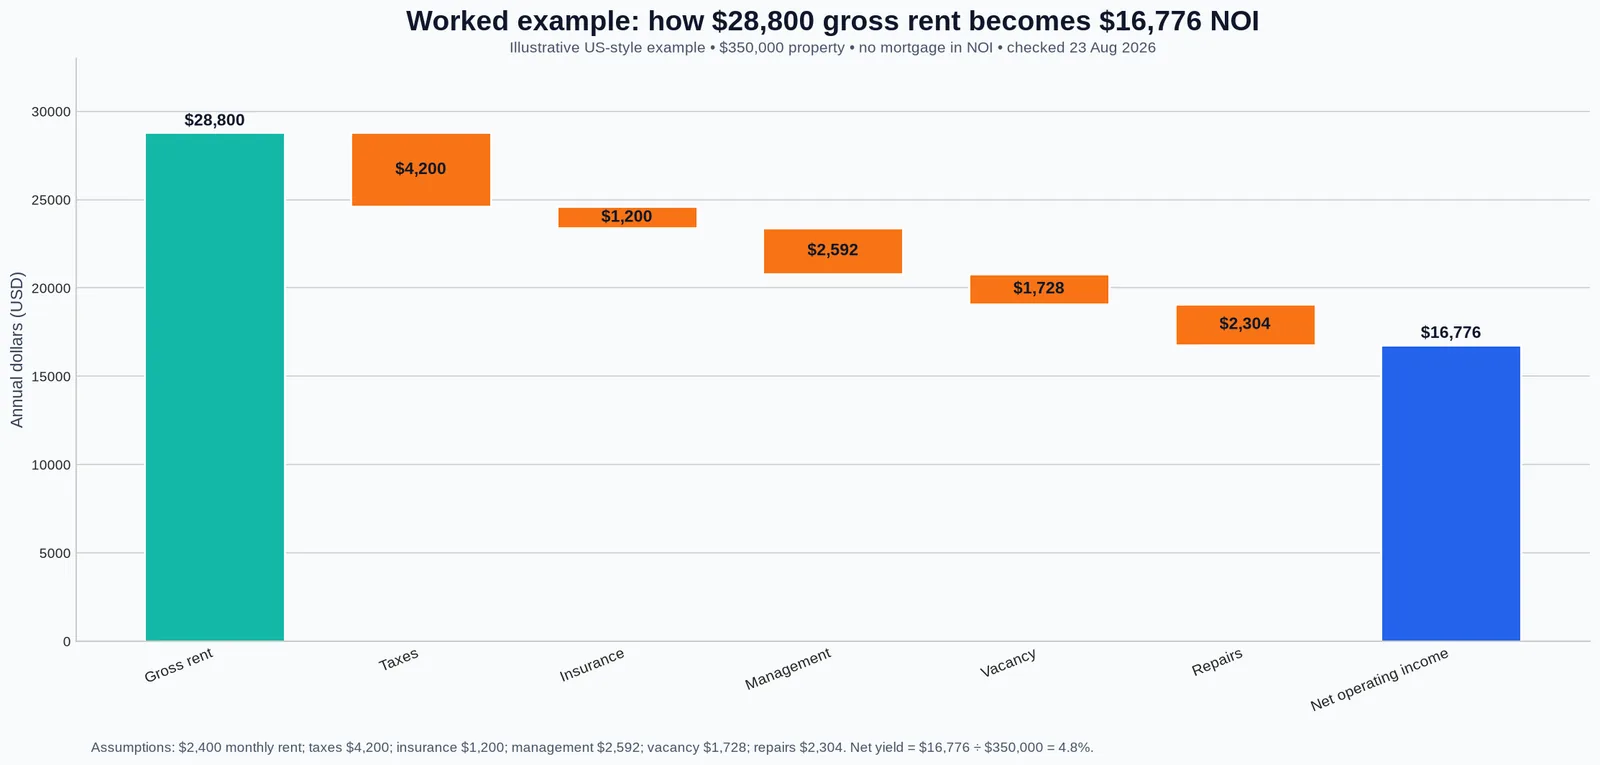
Accessible text alternative for the expense bridge: start with $28,800 annual gross rent. Subtract $4,200 property taxes, $1,200 insurance, $2,592 management, $1,728 vacancy and $2,304 repairs. The total operating-cost subtraction is $12,024, leaving $16,776 net operating income. Divide $16,776 by the $350,000 property value to get 4.8% net yield. The mortgage is intentionally not in this bridge; test it separately in cash-on-cash analysis. This text summary, Table 1 and the CSV contain the same USD assumptions for screen-reader and spreadsheet users.
Calculator privacy note — applies to every calculator link in this guide: the estimate runs in your browser without a login, and the site does not need sensitive identity, bank or tenant information for the math. A CSV download is user-initiated and contains the labelled illustrative worked example, not your private calculator inputs. Review the Privacy Policy and use redacted figures when testing.
Change any line and the answer moves. Management at 10 percent instead of 9, vacancy at 8 percent, and repairs at 10 percent push operating costs to roughly $14,400 and drop the net yield to 4.1 percent. The Cash Flow Calculator keeps every line visible so these assumptions are decisions, not defaults.
Why vacancy is a line item, not an accident
Every rental is empty for part of the year, and the cost is the lost rent plus the turnover spend — cleaning, marketing, and the days between tenants. A property that turns over every 12 months typically loses two to four weeks of rent plus re-letting costs, which is 5 to 8 percent of annual rent on a normal year. Budgeting zero vacancy is how landlords discover that their 6 percent yield is really 4.5.
The Break-Even Occupancy Calculator inverts the question: it shows how many occupied days the property needs to cover its costs, which is the honest version of the vacancy question. A property that breaks even at 85 percent occupancy is a safer hold than one that needs 98 percent, and the difference between those two numbers is built from exactly the expense list above.
Net yield versus cash-on-cash return
Net yield divides net operating income by the property value. Cash-on-cash divides cash flow — net operating income minus the mortgage — by the cash you actually invested, the down payment and closing costs. The two answer different questions, and conflating them is the most common landlord mistake.
On the worked example with 20 percent down ($70,000 deposit plus $10,000 of closing costs, so $80,000 cash invested) and an illustrative $280,000 mortgage at 6.5 percent over 30 years, the payment is about $1,770 a month, or $21,240 a year. The 6.5% rate is a dated teaching assumption, not a current quote; use Freddie Mac PMMS for US mortgage-rate context and obtain a lender quote for a real decision. Cash flow is $16,776 minus $21,240 — negative $4,464 a year. The net yield is a healthy 4.8 percent while cash-on-cash is minus 5.6 percent: the property covers its operating costs but not its financing. Both numbers are true, and both matter. The ROI Calculator computes both sides of this on the same inputs, and the Rental Yield Calculator keeps the operating view separate from the financing view.
What counts as a good net yield
A good net yield depends on the market and the financing. In high-appreciation markets like parts of the US and Australia, net yields of 3 to 5 percent are normal because the total return is expected to come from price growth. In higher-yield markets — parts of the UK, the US Midwest, and many secondary cities — net yields of 5 to 7 percent are available, with higher risk of vacancy and lower appreciation. The number to compare is the total return: net yield plus expected annual appreciation, which the Property Appreciation Calculator and Capital Gain Calculator estimate separately.
The practical rule: if a property's net yield is below your mortgage rate, your cash flow is negative by construction unless the rent grows or the rate falls, and you are buying for appreciation alone — which is a valid strategy but a different one from cash-flow investing. Landlords who know their net yield and their cash-on-cash before they offer rarely discover either for the first time on a tax return.
Net yield versus cap rate: the one-line difference
Cap rate and net yield look identical — both divide net operating income by a value — but the denominators differ. Net yield divides by the purchase price you paid; cap rate divides by the current market value. For a buyer, the two are the same number at the moment of purchase. For an owner, they drift apart as the market moves: a property bought for $350,000 that appreciates to $500,000 keeps its original net yield of 4.8 percent on your purchase price while its cap rate on current value falls to 3.4 percent. The cap rate is what the market would pay today; the net yield is what your investment actually earns. Both are useful, and confusing them is how owners convince themselves an appreciating property still earns the yield they bought it at.
The Cap Rate Calculator prices the market view and the Rental Yield Calculator prices your view — running both on the same property keeps the distinction honest, and the Property Appreciation Calculator shows how quickly the gap widens.
Furnished versus unfurnished yields
Furnishing changes both the rent and the cost side of the yield equation. A furnished unit typically rents 15 to 25 percent higher than the same unit unfurnished, but the capital outlay — furniture, appliances, soft goods — runs anywhere from $8,000 to $25,000 depending on the market, and the replacement cycle is three to five years, with a higher wear-and-tear repair line. The honest comparison is the net yield after furniture depreciation on both sides, not the headline rent premium.
On the worked example, furnishing the $350,000 property might lift rent from $2,400 to $2,900 a month, adding $6,000 a year in gross rent — but at a $15,000 furnishing cost and a five-year replacement cycle, the real uplift is $6,000 minus $3,000 of annualized furniture cost, and the vacancy and repair lines rise with tenant turnover. The net effect is often half the headline premium. The Cash Flow Calculator lets you add the furniture line explicitly, and the furnished versus unfurnished decision goes deeper on the same trade-off.
Regional net yield benchmarks
Regional net-yield ranges are not universal official benchmarks: they change with purchase price, rent evidence, taxes, insurance, vacancy, management, repairs, financing and the exact property. Do not treat illustrative ranges in market commentary as a promise of return. Build the denominator and rent input from official local data, then add property-specific operating lines.
For US inputs, the FHFA House Price Index provides house-price context. For the UK, the ONS private-rent and house-price release dated 19 August 2026 provides rent and price statistics. For Canada, Statistics Canada housing data provides price, rent and vacancy pathways. For Australia, the Australian Bureau of Statistics rental-market article explains its CPI rent dataset.
These sources make rent and price inputs auditable; they do not calculate a property-specific net yield, verify your expenses or replace a local rent quote, inspection and insurance estimate.
| Market | Official input route | What it can support | What it cannot prove |
|---|---|---|---|
| US | FHFA HPI, checked 23 August 2026 | House-price movement by state, metro, county and ZIP-level datasets. | A property’s rent, expenses, vacancy or net yield. |
| UK | ONS private rent and house prices, released 19 August 2026 | Rent and house-price levels or changes by UK area, with revisions and quality notes. | A landlord’s achieved rent, operating costs or after-tax return. |
| Canada | Statistics Canada housing statistics, checked 23 August 2026 | Housing-price, rent, vacancy and regional housing-data pathways. | A complete investment return without property-level underwriting. |
| Australia | ABS rental-market insights, released 28 May 2025 | Rent-distribution and rental-market context with dataset limitations. | A current property-level rent, vacancy or net yield without local evidence. |
Table 2 provenance: each route links directly to the named official statistical publisher. Use the source's own geography, definition, release date and quality notes; do not combine a national rent series with a city-level price denominator without explaining the mismatch.
The pattern is consistent: yield and appreciation trade against each other, and the market with the higher yield usually expects the lower price growth. A landlord comparing a 6 percent net yield in one city against a 3 percent yield in another is really choosing between income now and growth later. The Property Appreciation Calculator turns that choice into numbers, and the country hubs keep the buying-side costs of each market in one place.
Five mistakes that wreck the yield math
- Using the asking price instead of the true all-in cost — purchase price plus closing costs changes the denominator
- Budgeting zero vacancy — real portfolios run 5 to 8 percent, and turnover years run higher
- Ignoring the management fee — self-management saves the 8-10 percent line but costs time that has a value
- Adding the mortgage to the yield — it belongs in cash-on-cash, not yield, and mixing the two inflates or deflates the answer
- Confusing net yield with the return on equity later in ownership — as the mortgage amortizes, cash-on-cash rises while the yield stays flat
The last one is the one landlords learn about after five years of ownership. Early in the loan, cash-on-cash and net yield look similar; late in the loan, the mortgage payment is mostly principal and the cash flow balloons while the yield line is unchanged. Neither number is wrong — they answer different questions — but a landlord who reads the rising cash flow as a rising yield is misreading the property. Run both with the ROI Calculator every year, and the distinction stays visible.
How to improve net yield without buying another property
- Push rents to market at turnover — the single biggest lever, worth 5 to 10 percent on the rent line
- Cut the management percentage by negotiating on multiple units or a long-term contract
- Reduce vacancy with longer leases and renewal incentives cheaper than a turnover
- Capex that lifts rent — a kitchen or bathroom refresh typically recovers its cost within two to three years of added rent
- Review insurance and property tax annually — both lines creep and both are shoppable or appeal able
Every lever moves the same equation: more net income over the same value. On the worked example, raising rent to market at turnover ($2,400 to $2,520, a 5 percent bump) adds $1,440 of net income and lifts the net yield from 4.8 to 5.2 percent.
Cutting vacancy by two points adds roughly another $580 and pushes the example past 5.4 percent. Small changes compound, but they are not guaranteed: recheck the local rent evidence, leasing cost, repair reserve and insurance before relying on the result. The Rental Yield Calculator recomputes the model as you adjust each line — use it as a live scenario tool, not a one-time calculation.
Local checks before you underwrite
- US: confirm the assessor tax bill, landlord insurance quote, state and local landlord rules, and rent evidence for the exact ZIP or metro; use FHFA for price-trend context, not as a rent forecast.
- UK: confirm achieved rent, council tax or service-charge treatment, insurance and rental-income rules using GOV.UK and local market evidence; ONS statistics are context, not a property-specific yield.
- Canada: check provincial and municipal taxes, vacancy/repair assumptions, rent rules and the relevant Statistics Canada or CMHC data route before comparing cities.
- Australia: check state or territory charges, insurance, property-management terms and local rent evidence; ABS rental data describe market context and do not replace an achieved-rent quote.
Calculator privacy and export: the linked calculators run the calculation in the browser for the estimate and do not need a login to perform the math; review the Privacy Policy before entering sensitive information. The worked example is also available as a downloadable Net Yield CSV with metadata, units, formulas and assumption notes so you can replace the illustrative inputs in a spreadsheet.
Running your own numbers
The sequence that prevents self-deception: gross yield for screening, net yield with every operating line filled in for the hold decision, and cash-on-cash with your actual deposit and rate for the investment decision. On the worked example, the full picture is gross 8.2 percent, net 4.8 percent, cash-on-cash minus 5.6 percent — and only the last number reflects your money at work.
One caution on the way out: yields quoted by agents and portals are almost always gross yields, because gross is the number that makes a listing look best. A so-called 8 percent yield in an advertisement is a rent-to-price ratio, not a return — the same property will typically show 4 to 5 percent net once the full expense list is applied, and less still if the mortgage is included. When a deal looks better than the market, the first assumption to check is whether the yield was computed net or gross; the second is whether vacancy and repairs were honestly budgeted. The Rental Yield Calculator shows both numbers side by side so an advertised gross yield converts to a realistic net figure in seconds rather than after a purchase.
Run your own property through the Rental Yield Calculator and Cash Flow Calculator before you offer, stress the vacancy and repair lines upward, and keep the honest numbers in front of you. For the wider picture of how yield, cap rate, and cash flow fit together, the cap rate explained guide and the what is a good rental yield guide go deeper on the same math.
Sources
- FHFA — House Price Index — US house-price data and methodology, checked 23 August 2026
- ONS — Private rent and house prices, UK: August 2026 — UK rent/price statistics, released 19 August 2026
- Statistics Canada — Housing statistics — Canadian housing data pathways, checked 23 August 2026
- Australian Bureau of Statistics — Latest insights into the rental market — rental dataset context, released 28 May 2025
- GOV.UK — Tax on rental income — UK tax verification starting point, checked 23 August 2026
Related reading
Continue reading: DSCR Guide: From 1.10 to 1.25 · Rental Yield vs Total Return · Rental Yield vs Total Return. Run your own numbers with the Rental Yield Calculator — it takes under a minute and beats guessing.
A worked net-yield example from start to finish
Worked example — United Kingdom (GBP)
Take a £240,000 flat that rents for £1,300 a month. Gross rent is £15,600, which is a headline 6.5 percent yield. Now subtract the operating costs: £900 a year of letting-agent management at 7 percent, £480 of insurance, £1,050 of ground rent and service charge, £650 of repairs averaged over five years, and a £1,300 vacancy allowance of one month. Total costs are £4,380, leaving net operating income of £11,220. Divide by the £240,000 price and the net yield is 4.68 percent — a third lower than the headline number. This is the figure that actually funds your mortgage and pays you, which is why every serious landlord quotes net yield and treats the gross figure as marketing.
UK scope note: this is an illustrative GBP calculation, not a survey of UK yields or a tax computation. Replace the rent, council-tax or service-charge treatment, insurance, letting fees, repairs, vacancy and financing with evidence for the exact property; use the GOV.UK rental-income tax guidance for a current verification path.
- Check your own figures with the Rental Yield Calculator and the Cash Flow Calculator.
Frequently asked questions
How do you calculate net yield on a rental property?
Annual rent minus annual operating costs (taxes, insurance, management, vacancy, repairs, HOA fees), divided by the property value. On a $350,000 property renting for $2,400 a month with $12,024 of costs, the net yield is 4.8% versus 8.2% gross.
What expenses are subtracted from net yield?
Property taxes, insurance, property management (8-10% of rent), vacancy (5-8%), repairs and maintenance (5-10%), HOA fees, and any utilities you pay. Mortgage payments are excluded — they belong in cash-flow analysis, not yield.
What is the difference between net yield and cash-on-cash?
Net yield divides operating income by property value; cash-on-cash divides cash flow after the mortgage by the cash you invested. A property can show a healthy 4.8% net yield while cash-on-cash is negative once financing is included.
Is 8% gross rental yield good?
It depends on the market and financing. Gross yield ignores costs — 8% gross often becomes 4-5% net. Compare net yield against your mortgage rate: if net yield is below the rate, cash flow is negative by construction.
How much should I budget for vacancy?
Five to eight percent of annual rent covers normal turnover: two to four weeks vacant plus re-letting costs each year. Budgeting zero vacancy is how landlords discover their real yield is a point or two lower than advertised.
Is net yield calculated before or after tax?
Strictly, net yield is a pre-tax figure: it divides net operating income (rent minus operating costs) by the property value or purchase price, and income tax is excluded because it varies with your personal circumstances. Some landlords quote an after-tax yield by subtracting their marginal tax rate, which is useful for comparing against your own alternative investments but not for comparing across properties.