 By Nirmal Lashkari · Founder · Indore, Madhya Pradesh, India
$2,400 monthly full-occupancy rent, with $600 in operating costs and $1,400 in debt service, the calculator requires 83.3% occupancy to break even. This means rent collected at that occupancy covers the combined $2,000 monthly expense load, leaving approximately 16.7% occupancy as vacancy cushion before operating costs and debt service are no longer covered.
Feasibility
Achievable occupancy
Occupancy needed to break even: 83.33%
The lower this figure, the more cushion you have against vacancy.

This calculator estimates the percentage of a property's maximum monthly rent that must be collected to cover two monthly obligations: operating costs and debt service. It is an operating-screening ratio, not a forecast of demand or a promise of profitability. The full-rent figure represents the income ceiling in the model; the result asks how much of that ceiling is needed before the entered costs are covered.
The result has two parts. A feasibility label says either Achievable occupancy or Cannot break even at full occupancy. A highlighted percentage states Occupancy needed to break even. The companion note explains the direction of the result: a lower requirement generally means more modeled room for vacancy, while a requirement near the ceiling leaves little room for disruption.
Monthly rent at full occupancy is the total rent the property would produce if every modeled unit or space were occupied at the assumed rent. For example, six spaces at $900 each produce $5,400 of full monthly rent. Enter the combined figure, not the rent of one unit. Keep ancillary income out unless you intentionally include it in this total and use the same convention in every scenario.
Monthly operating costs are the recurring costs required to run the property before debt service. Assemble the monthly equivalent of the costs relevant to your model, such as owner-paid utilities, maintenance, management, insurance, taxes, cleaning, and routine contracts. Monthly debt service is the periodic payment obligation, not the loan balance and not an annual total. All three fields are dollar inputs with a minimum of zero.
The ratio is calculated as (monthly operating costs plus monthly debt service) divided by monthly rent at full occupancy, then expressed as a percentage. With $600 of operating costs, $1,400 of debt service, and $2,400 of full rent, the numerator is $2,000 and the denominator is $2,400. The result is 0.833333..., displayed as approximately 83.33 percent.
Because both costs are in the numerator, either one increases the required occupancy when it rises. Because full rent is the denominator, a larger credible rent capacity lowers the percentage. The component formats the numeric result as a percentage and compares the requirement with the full-occupancy limit to select the feasibility message.
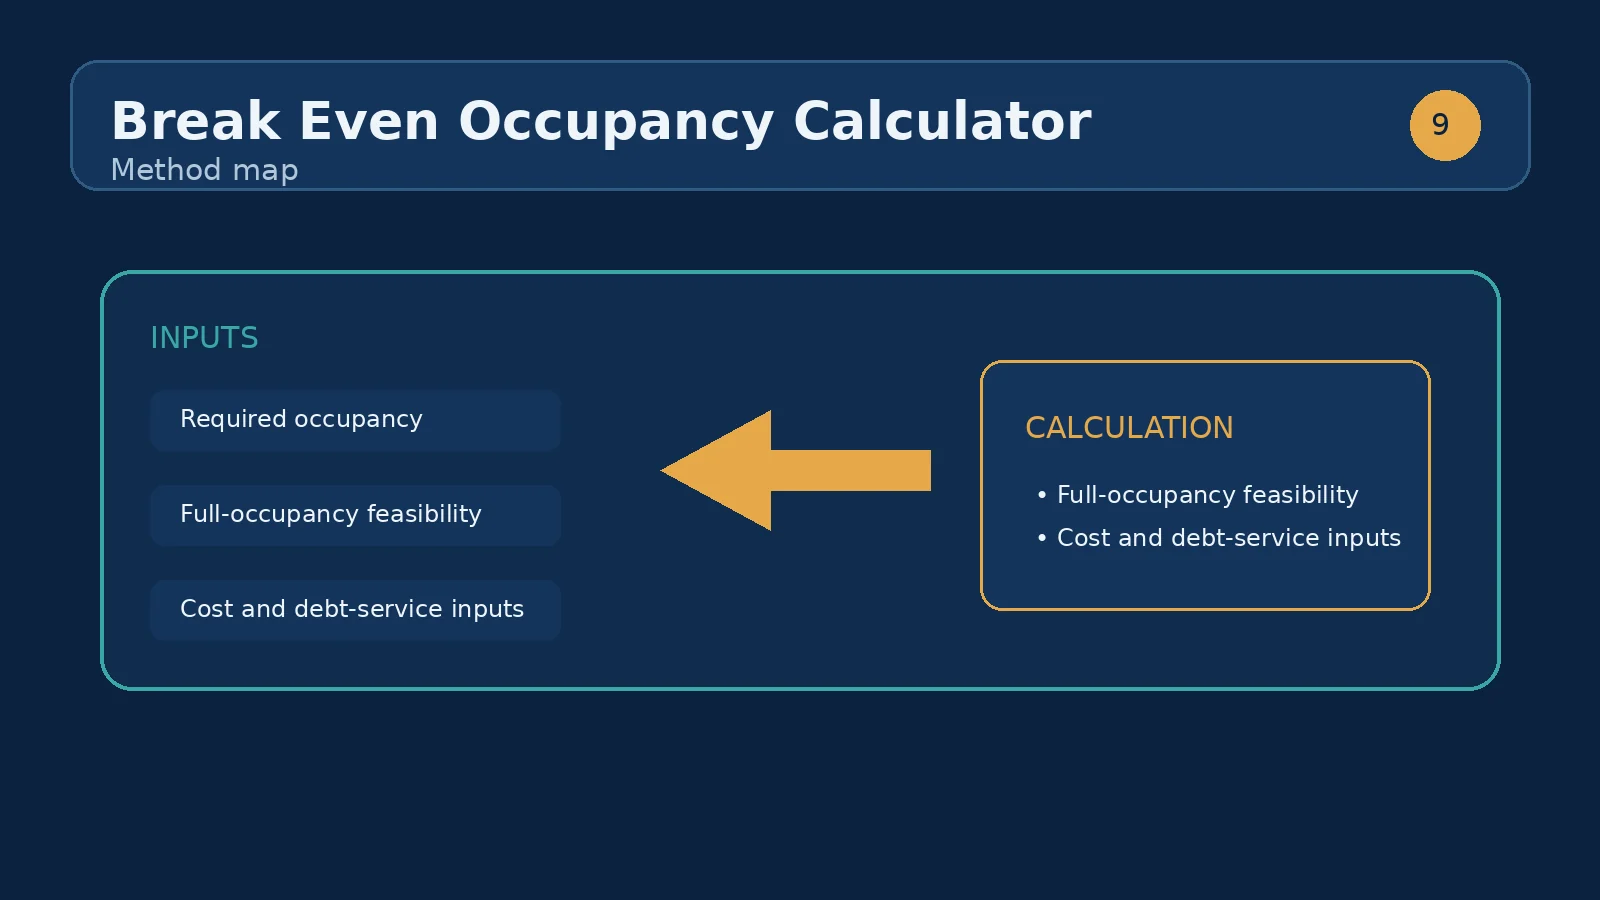
Start with the displayed defaults: $2,400 monthly rent at full occupancy, $600 monthly operating costs, and $1,400 monthly debt service. The property needs $2,000 each month to cover the entered costs. Dividing $2,000 by $2,400 gives 83.33 percent, so the result is Achievable occupancy.
Read the figure as a collection threshold within this model. If the full-rent assumption describes ten equal units, 83.33 percent is a ratio rather than a literal instruction to occupy 8.33 units. Real properties have different rents, turnover timing, concessions, and collection patterns. The scenario therefore tells you the required income share, then invites a second pass using more cautious assumptions.
Hold the defaults constant and raise operating costs to $800. The monthly requirement becomes $2,200, and the occupancy requirement becomes 91.67 percent. Instead, keep operating costs at $600 and reduce debt service to $1,200. The monthly requirement becomes $1,800, producing a 75.00 percent requirement. These tests isolate how changes in recurring costs or financing affect the same rent capacity.
Now hold the $2,000 monthly requirement constant and change full rent. At $2,400, the requirement is 83.33 percent; at $2,500, it is 80.00 percent. A higher denominator improves the ratio mathematically, but it is useful only if the rent assumption is supportable. Compare one changed input at a time, record the displayed percentage, and preserve the scenario labels so an optimistic result cannot be mistaken for a base case.
Achievable occupancy means the calculated requirement is at or below the model's 100 percent full-rent capacity. It does not certify that tenants will be found, rents will be collected, or costs will remain stable. Cannot break even at full occupancy means the entered costs exceed the entered maximum monthly rent. More occupancy cannot repair that particular gap because the denominator has already been set to its ceiling.
The cushion is the distance between the requirement and 100 percent. An 83.33 percent requirement leaves 16.67 percentage points of modeled capacity; a 95 percent requirement leaves only 5 points. This is not a separate output or a guaranteed profit margin. Unentered expenses, repairs, turnover, missed collections, or a payment change can consume the apparent cushion, so use it as a comparison signal rather than a safety guarantee.
Period mismatch is the fastest way to corrupt the result: annual taxes beside monthly rent, or an annual debt payment beside monthly operating costs, makes the ratio meaningless. Other frequent errors include using one unit's rent as full rent, omitting owner-paid expenses, counting the same service in two categories, and entering a loan balance where a monthly payment belongs. Reconcile every figure to a monthly basis before pressing the calculator into service.
A useful workflow is to build a base case, then run a downside case with lower full rent and higher operating costs. Confirm that the feasibility status is understood, not merely that the percentage looks low. If the ratio exceeds 100 percent, revisit rent capacity, cost structure, and debt service rather than trying to solve the issue with a vacancy assumption. Keep a written assumption list so the next review can reproduce the same result.
When debt service comes from a proposed purchase or refinance, the next useful analysis is the Home Affordability Calculator. This occupancy tool tells you what share of modeled rent is needed to cover the entered monthly costs; an affordability-focused tool can help examine the payment assumption that feeds the debt-service field. Transfer a clearly labeled monthly payment into a new occupancy scenario instead of treating the two outputs as interchangeable.
A sound sequence is to establish full-rent capacity, assemble recurring operating costs, enter monthly debt service, read the percentage and feasibility label, and then stress the inputs. If the result remains workable after cautious changes, it is a stronger screening case. If it fails at full occupancy, the model needs a structural change in rent capacity, costs, financing, or operating plan before the projection is relied upon.
Lower is safer. A figure well below typical market occupancy gives you a cushion against vacancy, rate rises, and unexpected repairs.
The property cannot cover its costs even when fully occupied, which means the deal does not work at these numbers.
It is the total monthly rent assumed when every modeled unit or space is occupied and paying the entered rent.
Operating costs plus debt service exceed the monthly rent at full occupancy, so the entered income ceiling cannot cover the entered obligations.
No. Convert it to a monthly payment first, because all three component inputs are monthly amounts.
No. It reports the share of full-rent capacity required to cover the entered costs; it does not forecast occupancy or collections.
Yes. Combine the assumed monthly rents for all units or spaces into one full-occupancy total, using consistent assumptions.
Within this model, it indicates more distance from the 100 percent income ceiling and therefore more modeled room for vacancy or missed collections.
How landlords calculate net yield: the expense list that separates net from gross, vacancy and management math, and why net yield is not the whole story.
A practical, math-driven playbook to move a rental DSCR from 1.10 to 1.25 — worked scenarios, lender rules, decision framework, and a live calculator.
Break-even occupancy for landlords: the occupancy percentage you need to cover costs and debt service, with a worked example.
How we calculate: calcBreakEvenOccupancy in calculators.ts; regression checks in calculators.test.ts
Last reviewed: . Learn more about Nirmal Lashkari and LashkariProperties.
Disclaimer: This calculator provides estimates for informational purposes only and is not financial, tax, or legal advice. Verify figures with a qualified professional before making decisions.
