 By Nirmal Lashkari · Founder · Indore, Madhya Pradesh, India
$24,000 annual NOI divided by $17,000 annual debt service produces a DSCR of 1.41, which meets the lender minimum of 1.25. The calculator displays the DSCR to two decimal places and separately reports net operating income of $24,000 and annual debt service of $17,000.
Rental income minus operating expenses, before debt.
Total yearly mortgage principal and interest.
Share of rent consumed by taxes, insurance, management, vacancy.
Lender threshold
Meets minimum
DSCR: 1.41
Required rent to qualify
To hit a 1.25 DSCR you need $2,361.11/mo in rent (after a 25% expense ratio) — about $21,250.00of NOI a year. If the property can't rent for that, the deal fails the lender test at the current price.

The debt service coverage ratio, or DSCR, compares a property’s annual net operating income with its annual debt service. It asks a focused question: after the operating costs represented in NOI, is there enough income to cover the scheduled principal-and-interest obligation? The calculator expresses that relationship as NOI divided by annual debt service. A result of 1.00 means the two amounts are equal; a result above 1.00 leaves a cushion; a result below 1.00 indicates a shortfall on the inputs entered.
This is a coverage measure, not a complete investment return measure. It does not calculate property value, loan proceeds, interest rate, taxes, appreciation, cash-on-cash return, or a forecast of future rent. It also does not decide whether a lender will approve a loan. The visible result is a disciplined starting point for comparing income with debt, provided NOI and debt service use consistent annual figures. Coverage should be read as a relationship rather than a score attached to the building: the same property can show a different DSCR after a loan changes, and the same loan can show a different DSCR after operating income changes. That is why scenario labels matter when you compare results.
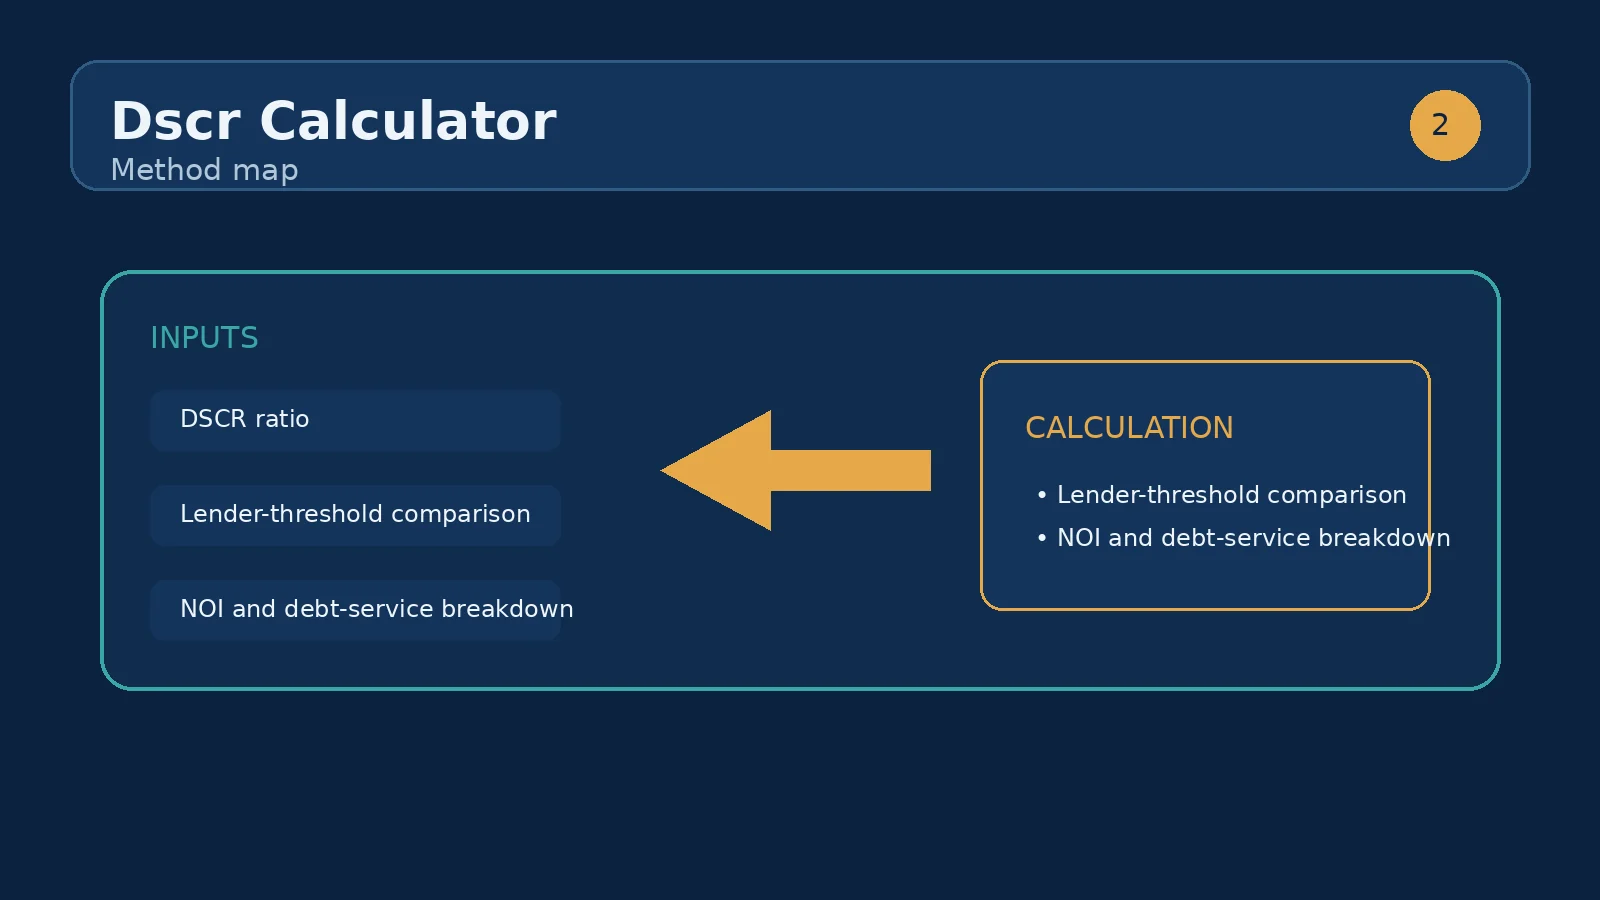
Annual net operating income is the first input. Enter the property’s yearly NOI, meaning rental income and other operating income after the operating expenses you intend to include, but before debt service. The component’s hint describes it as rental income minus operating expenses, before debt. Enter a nonnegative annual amount. If the property produces $24,000 of NOI, type 24000 rather than a monthly figure of 2000.
Annual debt service is the second input. It represents the total yearly mortgage principal and interest shown by the component’s hint. If scheduled principal and interest are $1,416.67 per month, the annual input is $17,000. Do not enter only the interest portion, and do not mix a monthly payment with an annual NOI. The calculator permits zero, which is why the output can report that DSCR is not applicable when there is no debt service.
Lender minimum DSCR is the comparison threshold. The field accepts decimal values and moves in 0.05 steps in the interface. A minimum of 1.25 means the calculated ratio must be at least 1.25 to receive the “Meets minimum” status. This is an assumption supplied by the user, not a universal rule embedded in the calculator. Before comparing two properties, use the same definition of NOI, the same annual convention, and a clearly recorded minimum. If one case includes a reserve or vacancy deduction and another does not, the ratios are not like-for-like even when both fields appear plausible. Consistency is more valuable than false precision. Check whether an operating statement reports annual figures, trailing figures, or a forward budget. The calculator performs the division you request; it cannot know whether the period chosen is representative. A careful user therefore tests a base case and a conservative case instead of relying on one attractive ratio.
When annual debt service is greater than zero, the ratio is NOI divided by annual debt service. With $24,000 of NOI and $17,000 of debt service, the unrounded relationship is 24,000 ÷ 17,000, or approximately 1.4118. The result display formats DSCR to two decimal places, so the visible ratio is 1.41. The same output card repeats the normalized NOI and annual debt service as currency, allowing you to confirm that the calculator interpreted the two amounts as intended.
The threshold test compares the calculated DSCR with the minimum entered. In the example above, 1.41 is greater than 1.25, so the status reads “Meets minimum.” If the ratio is 1.18 against a 1.25 minimum, the status reads “Below minimum.” The comparison is mechanical: changing either annual amount or the minimum changes the status, while the calculator does not add an unexplained buffer or make a qualitative judgment about the property. Because the displayed ratio is rounded to two decimals, use the underlying input relationship when a case sits very close to the threshold. Small changes in NOI or debt service can move a borderline result across the displayed status, so retain the exact assumptions used for each test.
Suppose a small rental produces annual NOI of $24,000 after the operating expenses used in your underwriting worksheet. Its scheduled annual principal and interest totals $17,000, and the lender minimum you want to test is 1.25. Enter 24000, 17000, and 1.25. The calculator returns DSCR 1.41, displays net operating income of $24,000 and annual debt service of $17,000, and marks the case “Meets minimum.”
Now keep NOI at $24,000 and test annual debt service of $20,000. The ratio becomes 1.20, which is below the same 1.25 minimum. The property did not become less profitable in this comparison; the debt obligation became heavier relative to the same operating income. Alternatively, keep debt service at $17,000 and reduce NOI to $20,000. That also produces 1.18 and fails the test. These paired tests help isolate whether the pressure comes from income assumptions or financing assumptions. Keep the original case beside each sensitivity rather than overwriting it. Label each row by NOI, debt service, and minimum, then copy the three displayed outputs: DSCR, net operating income, and annual debt service. That record makes a later conversation auditable and helps prevent a favorable scenario from being presented as though it were the base case.
The lender-threshold panel is deliberately simple. “Meets minimum” means only that the ratio calculated from the three inputs is at least the entered minimum. “Below minimum” means it is not. The green or danger-tinted panel is a visual cue, not a promise of approval, pricing, proceeds, or closing. “Not applicable — no debt service” appears when annual debt service is zero, because dividing NOI by zero would not produce a meaningful coverage ratio in this tool. The panel is therefore best used as a screening flag. It tells you which cases deserve a closer look, while the repeated currency outputs make it easier to spot a misplaced zero, an accidental monthly amount, or a debt figure copied from the wrong loan version.
A higher DSCR generally represents more income cushion relative to the entered debt service, but the size and reliability of that cushion still depend on the quality of NOI. A ratio of 1.41 built on temporary income may be less persuasive than a ratio of 1.30 built on stable, documented income. Treat the displayed ratio as a screening output, then reconcile it to leases, operating statements, reserves, and the debt terms that actually apply to the property.
Three comparisons make the output more useful than a single pass. First, compare NOI cases while holding debt service constant. At $17,000 of annual debt service, NOI of $20,000 produces 1.18, NOI of $24,000 produces 1.41, and NOI of $28,000 produces 1.65. This sensitivity shows how much coverage depends on the income line. Second, compare debt cases while holding $24,000 of NOI constant: $20,000 debt service gives 1.20, $17,000 gives 1.41, and $15,000 gives 1.60.
Third, compare minimum thresholds without changing the property. The 1.41 result meets a 1.25 minimum, but it would not meet a hypothetical 1.50 minimum. That is not a contradiction; it is a different screening standard. Because the component exposes the minimum as an input, you can document which threshold you used rather than silently comparing one property with another under different assumptions.
The most common mistake is mixing time periods. Monthly NOI divided by annual debt service understates coverage by a factor of roughly twelve; annual NOI divided by a monthly payment overstates it. Convert both figures to annual amounts before entering them. A second mistake is entering gross rent as NOI. Gross rent is before operating expenses, while the component specifically labels the input NOI and describes it as rent minus operating expenses before debt.
Another mistake is subtracting debt service from NOI and then entering the remainder as NOI. That double-counts financing and makes the ratio meaningless. Keep NOI before debt service, and put principal and interest in the debt-service field. Finally, avoid treating the minimum field as an output or as a guaranteed market rule. It is your comparison threshold. If the result is close to the minimum, rerun it after checking every annual conversion and every expense included in NOI. A clean borderline test is more informative than a rounded pass based on mismatched periods. Record its value beside the result whenever you save or discuss a scenario.
DSCR is not a substitute for a rental cash-flow review. It does not display vacancy, repairs, management, taxes, insurance, capital reserves, loan fees, or cash left after debt service. Those items belong in the construction of a defensible NOI and in a broader cash-flow analysis. It also does not show how much equity you contribute, so it cannot by itself answer whether the return on your cash is attractive. In practice, prepare the operating statement first, identify which expenses were deducted to reach NOI, and then enter the annual debt obligation from the proposed financing. This sequence keeps the ratio from becoming a polished label placed on an undocumented income estimate.
Use the Rental Cash Flow Calculator next when you need to translate income, operating costs, vacancy, and financing into a periodic surplus or deficit. Use the Cap Rate Calculator when the comparison is unlevered NOI relative to property price or value. If the question is how a different loan payment changes coverage, return here with a revised annual debt-service amount and compare the outputs under the same NOI definition. Keeping each tool’s denominator and time period explicit prevents a strong DSCR from being mistaken for a full investment case.
Many commercial and investment lenders look for 1.20 to 1.25 or higher, meaning income comfortably exceeds debt payments.
The property does not generate enough income to cover its debt payments, so you would need to fund the shortfall from other sources.
It means annual NOI equals annual debt service on the entered figures. There is no remaining operating-income cushion before any items outside the entered NOI definition.
It shows N/A when annual debt service is zero, because the ratio is not applicable without a debt-service denominator.
No. The calculator makes the minimum an editable input so you can test the threshold relevant to your comparison. It does not encode a universal lender rule.
Yes. The component labels annual debt service as total yearly mortgage principal and interest. Convert the scheduled payment to an annual amount before entering it.
Not directly. Convert monthly NOI to an annual amount so it matches annual debt service and the field label.
Only if vacancy has already been reflected in the NOI you enter. The calculator does not calculate a vacancy allowance separately.
No. It only means the entered ratio meets the entered minimum. Approval can involve additional underwriting information and conditions outside this component.
The visible field is constrained to nonnegative input, so a negative NOI cannot be entered through this component. Review the underlying operating model separately if it shows a loss.
Test a defensible higher NOI, a lower annual debt-service amount, or a different comparison minimum, one change at a time. Do not improve the result by omitting real operating costs.
Use the Rental Cash Flow Calculator for a fuller income-and-expense surplus view, or the Cap Rate Calculator for an unlevered NOI-to-value comparison.
A practical, math-driven playbook to move a rental DSCR from 1.10 to 1.25 — worked scenarios, lender rules, decision framework, and a live calculator.
DSCR explained: how lenders use the debt service coverage ratio, what a good number looks like, and how to improve yours.
Commercial property investment basics: how offices, retail and industrial differ from residential — yields, leases, tenant quality and the risks to weigh.
How we calculate: calcDscr in calculators.ts; regression checks in calculators.test.ts
Last reviewed: . Learn more about Nirmal Lashkari and LashkariProperties.
Disclaimer: This calculator provides estimates for informational purposes only and is not financial, tax, or legal advice. Verify figures with a qualified professional before making decisions.
