


Executive summary: the decision in four lines
- Use net rental yield to compare income today; use total return to compare wealth over the years you expect to hold the property.
- A high-yield Property A produces more seven-year rent in the worked USD example, but lower-growth Property B produces more total wealth before sale costs and tax.
- The result changes if you need cash sooner, use debt, pay different taxes or cannot tolerate a thin monthly cash flow; the objective must come before the metric.
- The companion chart and CSV expose every assumption. Replace the illustrative rent, cost, growth, tax and sale-cost inputs with local evidence before making a decision.
Scope and check date: this guide was checked on 23 August 2026. All dollar amounts in the worked examples are USD, unlevered teaching assumptions with a seven-year hold, flat rent, no income tax and no purchase costs unless stated. The 0.8% and 5.2% price-growth paths are illustrative scenarios, not forecasts or market averages. Taxes, transaction costs, rent rules and property data differ by country; consult qualified local professionals.
Rental yield is a snapshot of income this year. Total return is what you have after several years of that income plus the change in the property's price, minus the cost of buying and selling. Mixing the two is how investors talk themselves into the wrong building. A high yield is not a high return. A low yield is not a low return. They become the same number only in a world where prices never move and selling is free.
That world does not exist. Prices move, sometimes sideways for a long time. Transaction costs are large. Tax sits on both rent and gains. Once you accept those three facts, you stop ranking every listing by the bold percentage in the agent's email.
Why the trade-off keeps appearing
Streets that everyone wants to live on tend to be expensive relative to the rent they produce. The rent cannot keep up with the prestige, the school catchment, or the short walk to the station, so the yield looks modest. Streets that fewer people want, or that come with more management pain, have to offer more rent per pound of price or the building stays on the market. The extra yield is often compensation for weaker growth, higher vacancy, or more of your Saturday.
Neither side is morally better. An income investor who needs the rent to meet a living cost should not be bullied into a trophy postcode. A long-horizon investor who can fund a thin cash-flow year should not be bullied into a high-yield unit they do not want to own for a decade. The failure is using one metric to answer the other person's question.
Two properties, same price, seven years
Both buildings cost $318,000 USD. We will hold each for seven years, ignore leverage for a moment, and keep the operating ratios honest rather than flattering. Rent does not grow in this sketch, which is unkind to both but keeps the comparison clean. You can add rent growth later; it rarely reverses the ranking when price paths differ this much. These are checked 23 August 2026 illustrative assumptions, not a valuation or forecast.
Checked 23 August 2026 — illustrative USD case, not a market forecast. Property A is the high-yield unit. Monthly rent is $2,140 USD, so annual rent is $25,680 USD. Gross yield is 8.1 percent. Operating costs eat 38 percent of rent (voids, management, repairs, insurance, tax), leaving $15,922 USD a year. Net yield is 5.0 percent. Prices here grow at the illustrative 0.8 percent a year. After seven years the building is worth $336,241 USD. Capital gain is $18,241 USD. Seven years of net rent is $111,452 USD. Combined profit before sale costs and income tax is $129,692 USD, or 40.8 percent of the purchase price.
Checked 23 August 2026 — illustrative USD case, not a market forecast. Property B is the low-yield unit on a tighter street. Monthly rent is $1,065 USD, so annual rent is $12,780 USD. Gross yield is 4.0 percent. Costs are a lighter 30 percent of a smaller rent, leaving $8,946 USD a year. Net yield is 2.8 percent. Prices here compound at the illustrative 5.2 percent a year. After seven years the building is worth $453,458 USD. Capital gain is $135,458 USD. Seven years of net rent is $62,622 USD. Combined profit is $198,080 USD, or 62.3 percent of the purchase price.
- A: 8.1 percent gross, 5.0 percent net, $129,700 USD combined over seven years before sale costs and tax
- B: 4.0 percent gross, 2.8 percent net, $198,100 USD combined over seven years before sale costs and tax
- B still leads after a 2.5 percent sale-cost stress of $11,338 USD in this model, unless A's rent was the only cash you could live on
| Metric | Property A — high-yield | Property B — low-yield |
|---|---|---|
| Starting price | $318,000 USD | $318,000 USD |
| Monthly rent / cost ratio | $2,140 / 38% | $1,065 / 30% |
| Gross yield / net yield | 8.1% / 5.0% | 4.0% / 2.8% |
| Illustrative annual price growth | 0.8% | 5.2% |
| Ending value after 7 years | $336,241 USD | $453,458 USD |
| Seven-year net rent + capital gain | $129,692 USD | $198,080 USD |
| After 2.5% sale-cost stress | $121,286 USD | $186,744 USD |
Table 1 text alternative: both properties start at $318,000 USD. A produces $25,680 annual rent and $15,922 net rent at a 38% cost ratio; B produces $12,780 annual rent and $8,946 net rent at a 30% cost ratio. After seven years, A ends at $336,241 and B at $453,458 under the illustrative growth paths. Before sale costs and tax, combined profit is $129,692 for A and $198,080 for B; after a 2.5% ending-value sale-cost stress, the figures are $121,286 and $186,744.
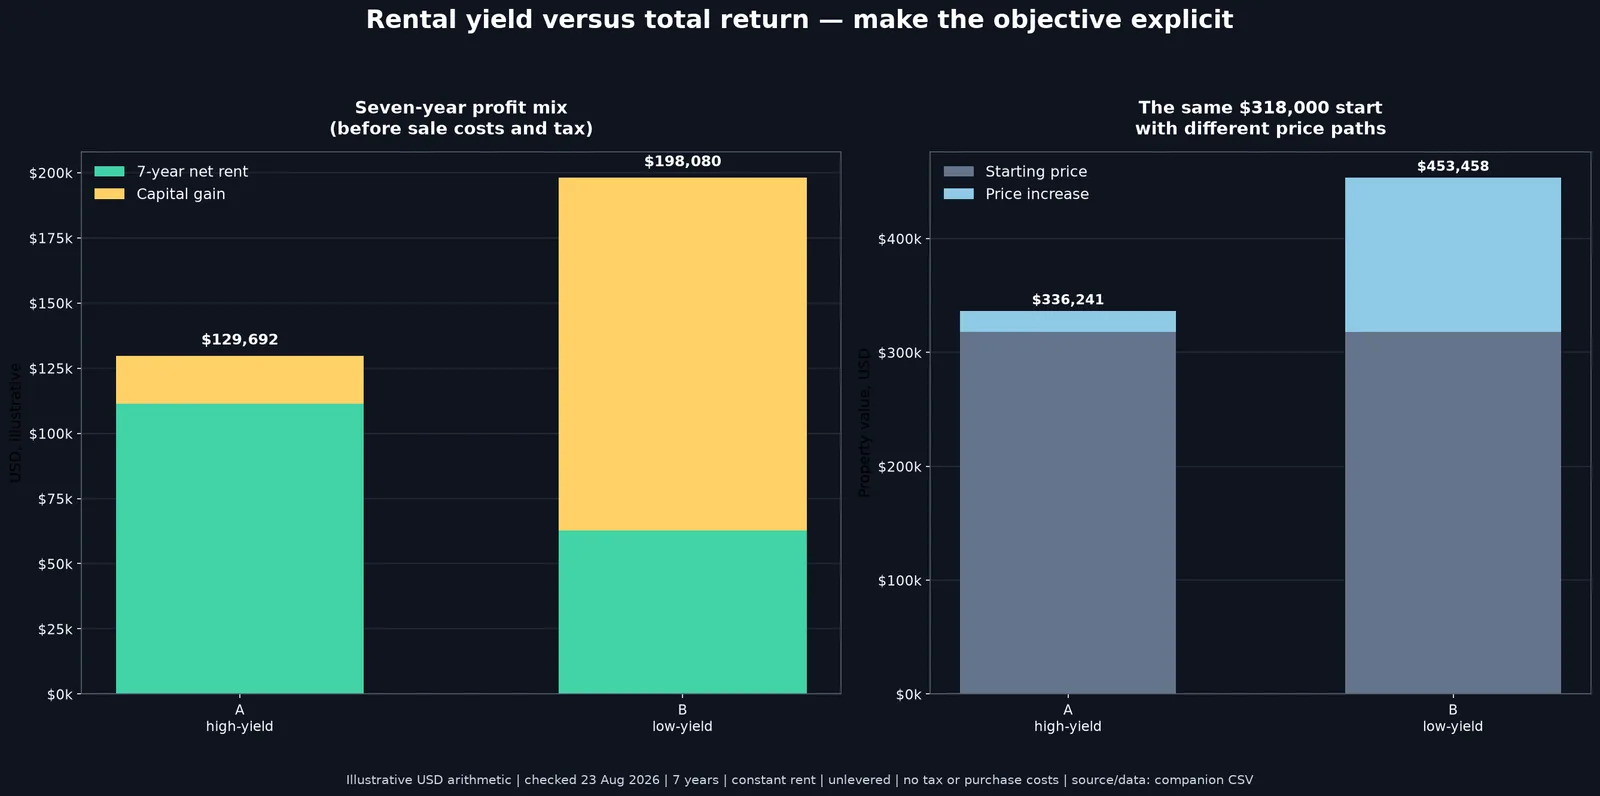
Figure text alternative: both properties start at $318,000 USD. A produces $111,452 USD of seven-year net rent and $18,241 USD of capital gain, for $129,692 USD before sale costs and tax; B produces $62,622 USD of net rent and $135,458 USD of capital gain, for $198,080 USD. Applying a 2.5% sale-cost stress to each ending value leaves $121,286 USD for A and $186,744 USD for B.
CSV field guide: property identifies A or B; years is the hold period; price_usd and monthly_rent_usd are starting inputs; cost_ratio and growth_rate are illustrative assumptions; annual_net_rent_usd, net_rent_total_usd, ending_value_usd and capital_gain_usd are derived outputs; sale_cost_rate and sale_cost_usd show the separate exit-cost stress. The file includes checked-date, scope and no-advice terms metadata.
If you needed $15,000 USD a year from the property to make the household work, A is the adult choice and B is a cash-flow problem dressed up as a better investment. If you did not need the income, B won on wealth. The metric did not fail. The objective was never stated.
Leverage changes the shape, not the definition
Borrowing multiplies both the income story and the growth story, and it adds a third story called interest. On B, a thin net yield can become negative cash flow once a mortgage is sitting on top of it. You are then paying each month for the privilege of holding an asset that might appreciate. That can be rational. It is also how people end up forced sellers in year three. On A, the fatter rent can cover a loan and still leave something, which is why high-yield units are often sold as 'the mortgage pays for itself.' Sometimes they do. Sometimes the 38 percent cost ratio was wishful, and they do not.
Total return on equity is the honest levered number: cash you took out, plus the equity you would have if you sold, minus the cash you put in. It is also the number most sensitive to your sale-cost and tax assumptions. Do not quote it without saying those assumptions out loud.
The quiet eaters of total return
Purchase costs and sale costs can erase the first two years of a low-yield strategy. If you buy B and sell in month eighteen, you have collected a little rent, paid a lot of tax and fees, and asked price growth to do a job it was never given time to do. Yield-focused buildings can fail the same test if you overpaid for 'the income' and then could not sell without a discount.
Tax sits differently on rent and on gains, and it sits differently in each country. We will not invent your treatment. The practical habit is to run the seven-year picture twice: once before tax, so you understand the asset, and once after a conservative tax haircut, so you understand the household. If the ranking flips, the tax is part of the investment, not an afterthought.
Common mistakes
- Choosing the higher yield and calling it the better investment
- Choosing the hotter postcode and calling the thin yield 'irrelevant'
- Comparing a gross yield on one building with a net yield on another
- Leaving out sale costs when you quote a seven-year return
- Using last decade's appreciation as if it were a coupon
- Ignoring the year you actually need the cash, which is a different question from lifetime wealth
How to use the free calculators
Run both buildings through the Rental Yield Calculator with the same honesty about costs, so you are comparing net to net. Use the Property Appreciation Calculator to see what a 0.8 percent path and a 5.2 percent path do to the same starting price over the years you expect to hold — then knock the growth rate down and look again. When a loan is involved, the ROI Calculator is where deposit, interest, and net income can sit on one page so yield and total return stop being slogans. The linked tools use visible labels associated with inputs by htmlFor/id, aria-describedby for hints, keyboard-focusable controls and text-rendered results; use keyboard Tab/Shift+Tab. Targeted source review found no calculator-specific localStorage/sessionStorage write or calculator API submission path. Do not enter sensitive personal data; the Privacy Policy explains site data handling. If an assistive technology cannot read a result, use the formulas and downloadable worked-example CSV instead.
Total return, written down as a formula
Total return = (net rent received over the holding period + change in price, minus buying and selling costs) divided by the starting price, expressed as a percentage. On Property B above: $62,600 USD net rent plus $135,500 USD capital gain, minus the modelled $11,338 USD sale-cost stress, gives $186,744 USD on a $318,000 USD start — 58.7 percent over seven years, or about 6.8 percent a year before tax. The same arithmetic on Property A gives $121,286 USD after its $8,406 USD sale-cost stress, or 38.1 percent over the period, about 4.7 percent a year. These are derived from the CSV assumptions and are not a forecast.
Two details matter when you write it down. First, an annualised percentage is not the same as a yield: it is the rate that turns your starting cash into your ending cash, compounding, over the years you actually hold. Second, sale costs and tax are not optional lines. Leave them out and the ranking between two properties can be decided by which one you forgot to tax.
How to run a local after-tax check
Do not subtract a made-up universal tax rate from the USD example. Instead, collect the same four inputs in your jurisdiction: net rental income, purchase costs/basis, sale proceeds and sale costs. Then ask a local tax professional how rental income, deductions, depreciation/allowances, capital gains and holding period are treated. The ranking can change after tax, but the tax line must be sourced to the actual owner and property.
| Market | Practical next step | Official starting point |
|---|---|---|
| United States | Separate rental income/expenses from adjusted basis and amount realised on sale; ask how Form 8949/Schedule D applies. | IRS Pub. 527 · Topic 409 |
| United Kingdom | Check allowable rental expenses and the current CGT reporting/timing rules for a non-home property; do not import US rules. | GOV.UK rental tax · GOV.UK property sale tax |
| Australia | Build a cost base including eligible acquisition/disposal items and check ownership, deductions and CGT timing with an adviser. | ATO rental-property CGT |
| Canada | Confirm rental-income records, sale proceeds and Schedule 3 treatment; check whether short-hold/flipped-property rules apply. | CRA selling a rental property |
When to use yield, and when to use total return
- Use net yield to compare the income of two buildings before financing is chosen
- Use cash flow to check whether you can hold the property month to month
- Use total return to compare the property with shares, bonds, or an index over the same years
- Use ROI on equity when a loan is involved, because it puts your actual cash in the denominator
- Use a five-to-ten-year horizon for total return, never a twelve-month one
The rule of thumb is brutal and useful: yield answers 'how does the rent compare with the price', total return answers 'what did this do to my wealth'. If you are deciding between two specific buildings, you need the first. If you are deciding whether property belongs in your portfolio at all, you need the second. The two discussions are not the same discussion, and ranking the whole asset class on a yield table is how people buy a REIT and then ask why it felt like a different product. For the mechanical version of the income side, how to calculate rental yield walks through the formulas step by step, and what is a good rental yield sets out the benchmarks investors actually compare against.
The year you need the cash
Total return is only yours once you sell, and selling is not free or instant. A property that ranks first on a seven-year spreadsheet can be a terrible investment for the investor who needs the money in year three, when the market is flat and the agents are quoting longer marketing times. The reverse is also true: a modest-yield building bought with a decade of patience and no forced exit can be the more rational choice precisely because it will never be sold into a bad week.
So add one more line to the comparison: the year you might need the cash, and what the local market would do to you if that year coincided with a quiet cycle. If your answer is 'I can wait', total return is a fair contest. If your answer is 'I might not be able to', income and liquidity deserve more weight than the spreadsheet is giving them. This is why the same $318,000 can be a sound buy for one household and a stretch for another — and why a fair comparison of the two properties above has to include the investor's calendar, not just the calculator's. Add the tax treatment of rent versus capital gains in your country and the ranking can shift again, which is why the guide ends where it began: name your objective, put a number on every line, and only then let the two metrics argue.
IRR: the strictest version of total return
The internal rate of return, or IRR, is the discount rate that makes all the cash flows of an investment add up to zero: the money you put in, the rent you collect each year, and what you finally get at the sale. It sounds like finance theatre, but it does one genuinely useful job. It punishes returns that arrive late. A property that makes all its money in the final year scores worse than one delivering the same total with steady rent in between, because the early dollars could have been compounding somewhere else.
You do not need to compute IRR by hand, and this site's calculators are honest about being estimates. What matters is the habit it trains: do not compare two properties on a single total at the end of seven years. Compare the shape of the cash flows. A thin-yield growth play concentrates its reward in the sale year and is therefore more sensitive to the exact sale price, the exact exit date, and the tax bill that lands on the gain. A steady-yield play pays you along the way, which forgives a mediocre exit. For a buyer with a fixed plan, that difference can matter more than the last point of annualised return.
If you want to check the mechanics against real numbers, the Rental Yield Calculator settles the income side, the Property Appreciation Calculator shows what each growth path does to the sale price, and how to calculate ROI on a rental property walks through the levered version with deposit and loan in the denominator.
The one-line summary, and the five questions it answers
Rental yield is this year's rent as a percentage of value; total return is everything over your holding period, net of costs, annualised. Keep those two definitions straight and five decisions get easier. Is the income real? Check net yield. Can I hold it? Check cash flow. Is this building fairly priced against its neighbours? Check cap rate. Is the whole investment worth my cash? Check total return on equity. And if the property only wins on one of the five, the question becomes which test you are willing to fail — which is the actual investment decision, dressed up in the language of returns.
Sources and local data routes
| Use this source for | Official route | Scope / caution |
|---|---|---|
| US rental income and expense concepts | IRS Publication 527 | US-specific; rental tax treatment is not universal. |
| US capital-gain basis and sale reporting | IRS Topic 409 | US-specific; basis, holding period and tax rules vary. |
| US property-price history | FHFA House Price Index | Single-family repeat-sales indexes; use local series, not a forecast. |
| UK property-price history | HM Land Registry UK HPI reports | Official UK statistics with revisions and provisional-estimate caveats. |
| Broader real-estate benchmarks | MSCI Real Estate | Benchmark definitions and coverage differ; check methodology before comparing. |
Use the official route that matches the property's jurisdiction and asset type. The IRS links are US tax references; FHFA is a US single-family price-index route; HM Land Registry is a UK price-index route. For Australia, Canada or another market, use that country's statistics and tax authority rather than translating the USD example. Sources checked 23 August 2026.
Related reading
Continue reading: How Landlords Calculate Net Yield (2026) · DSCR Guide: From 1.10 to 1.25. Run your own numbers with the Rental Yield Calculator — it takes under a minute and beats guessing.
The two-number rule investors actually use
Experienced buyers never quote a single return figure; they quote two. The income return — rent after operating costs as a percentage of price — tells them what the property pays while they wait. The total return adds projected capital growth, and the gap between the two is where markets differ. In a city with 3 percent net yields but 6 percent annual appreciation, the total return is 9 percent; in a high-yield market with 7 percent yields and 1 percent growth, it is 8 percent. The first market wins on paper, but only if the growth forecast is honest — and that is exactly where the models diverge and mistakes are made.
Frequently asked questions
What is the difference between rental yield and total return?
Rental yield measures this year's rent as a percentage of the property's value. Total return measures everything over your holding period: net rent plus price change, minus buying and selling costs. A high-yield property can have a lower total return than a low-yield one if prices grow faster elsewhere.
How do you calculate total return on a rental property?
Add the net rent you collect over the holding period to the change in the property's price, subtract purchase and sale costs, divide by the starting price, and annualise over the years held. In the seven-year example above, Property B returns about 6.8 percent a year against A's 4.7 percent.
Why is a high-yield property not always the better investment?
Because the yield says nothing about price growth or costs. Property A at 8.1 percent gross produced less total wealth over seven years than Property B at 4.0 percent, because B's 5.2 percent annual appreciation outweighed A's thin growth. Higher yield is often compensation for weaker price prospects.
Does rental yield include capital growth?
No. Rental yield is purely income divided by value. Capital growth only appears in total return. That is why comparing properties on yield alone is comparing them on half the picture, and why this page exists.
How does leverage change rental yield versus total return?
A mortgage turns both numbers into equity returns: your cash in becomes the denominator, and interest becomes a cost. A property with thin net yield can produce negative cash flow once leveraged, while the same building can still deliver a strong return on equity through appreciation. Run the ROI Calculator with your actual deposit and rate before you trust a headline yield.
Should rental yield include mortgage costs?
No. Yield is an unlevered metric: it divides net operating income by property value and deliberately excludes financing so you can compare properties without the distortion of different loan terms. Cash-on-cash return is the levered metric that includes the mortgage and measures what your actual equity earns. Comparing yield figures that mix in mortgage costs is how investors fool themselves into overpaying.
This article is educational. It is not financial advice or a forecast of rents or prices. Seven-year sketches depend on assumptions that will be wrong in the details. Use them to rank questions, then take personal advice if you need a recommendation on a specific purchase.