


Why ROI is misleading — until you fix it
Every property listing quotes a rental yield. Every agent has a spreadsheet showing ROI. Every You Tube guru has a magic number they claim beats the stock market. And yet the majority of rental properties bought in Tier-1 markets underperform the return their ownersthoughtthey were buying — often by half.
The reason is rarely bad markets. It is bad math. Return on investment sounds like one metric, but in practice it hides at least four distinct calculations that give wildly different answers on the same building: gross yield, net yield, cash-on-cash return, and total ROI. Add mortgage financing, appreciation, tax treatment, and stripping out the honest costs of owning a rented dwelling, and the number swings from "great deal" to "wealth destroyer" in a single line of your spreadsheet.
This guide takes the confusion apart. By the end you will be able to sit down with any listing, plug in real inputs, and produce two numbers you can actually defend: the cash-on-cash return the property will pay you next year, and the total ROI you will accrue as a landlord. We will use Tier-1 market examples (USA, UK, Canada, Australia, UAE), flag the costs that quietly wreck projections, and hand you a workflow you can repeat in twenty minutes for any deal — with free calculators from LashkariProperties doing the heavy lifting.
What you will learn
The five formulas that matter, the ten costs most beginner analyses miss, three fully worked examples across the US, UK, and UAE, and a stress-test framework that separates deals that pencil from deals that survive.
Key definitions and formulas
Before we compute anything, we need to agree on vocabulary. ROI is a family of formulas — not a single number — and mixing them up is the first mistake most new investors make.
1. Gross rental yield
The simplest and least useful measure: annualised rent as a percentage of the purchase price. It ignores every expense and every dollar of financing.
Gross Yield = (Annual Rent ÷ Purchase Price) × 100
Useful only as a first-pass screen — for example, filtering listings that clearly cannot cash-flow. A £350,000 property renting for £1,200/month has a 4.1% gross yield. Whether it is a good deal is another matter entirely.
2. Net rental yield
Rent after operating expenses, still ignoring financing. It answers a slightly better question: "if I paid all cash, what does this property yield?"
Net Yield = ((Annual Rent − Annual Operating Expenses) ÷ Purchase Price) × 100
3. Capitalization rate ("cap rate")
Effectively the same idea as net yield, but expressed against net operating income (NOI) and typically calculated at either purchase price or current market value.
Cap Rate = (Net Operating Income ÷ Property Value) × 100
Cap rate is the language of commercial and multi-family investors. It is powerful for comparing markets and asset classes on an apples-to-apples, unlevered basis. See our companion piece: Cap Rate Explained for Property Investors.
4. Cash-on-cash return (CoC)
The first number that includes financing. It answers the question every leveraged buyer actually cares about: "for every dollar of my own money in this deal, how much cash does it generate per year?"
Cash-on-Cash Return = (Annual Pre-Tax Cash Flow ÷ Total Cash Invested) × 100
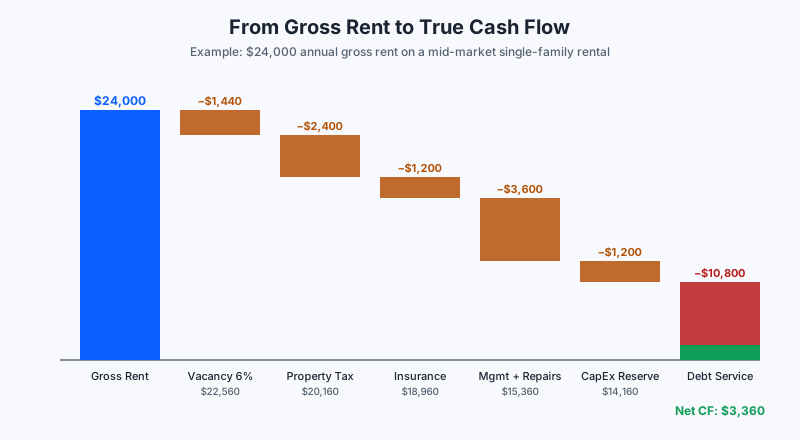
Annual pre-tax cash flow is what lands in your bank account: gross rent, minus vacancy, minus operating expenses, minus the full mortgage payment (both principal and interest). Total cash invested is your down payment plus closing costs, plus initial repairs, plus any working capital reserves. Deeper dive: Cash-on-Cash Return: How to Calculate It Properly.
5. Total ROI
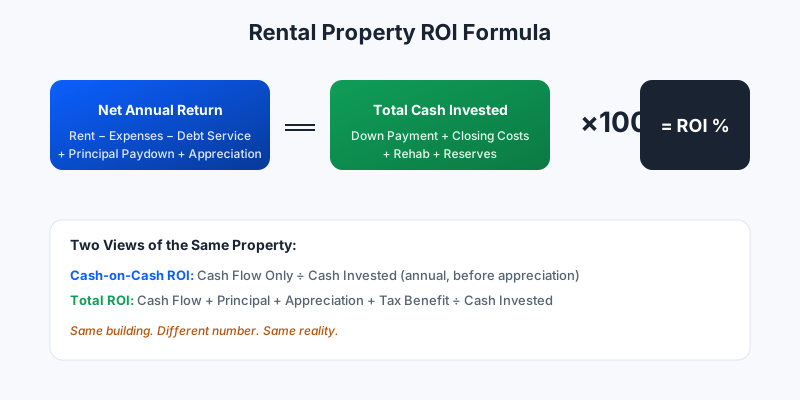
The most complete annual measure. It adds three wealth drivers that cash-on-cash ignores: principal paydown (each mortgage payment builds equity),appreciation (accrued market value gain), and — where applicable — tax benefits such as depreciation.
Total ROI = ((Cash Flow + Principal Paydown + Appreciation + Tax Benefit) ÷ Total Cash Invested) × 100
6. Internal rate of return (IRR)
A multi-year measure that accounts for the time value of money. IRR is the discount rate at which the net present value of all cash flows (including sale proceeds) equals zero. It is the metric professional syndicators live and die by, and it becomes essential once you plan holds longer than 3–5 years or sales at exit.
"Cap rate tells you what a building yields. Cash-on-cash tells you what your money earns. Total ROI tells you what your
Why this metric matters for buyers, investors, and landlords
ROI is not academic. It is the number that decides three practical things:
- Whether to buy at all.A property that cannot beat a passive index fund on a risk-adjusted basis probably should not be bought, no matter how attractive the neighbourhood.
- How much to bid.ROI runs backwards: for any given rent, financing, and expense stack, there is exactly one purchase price that hits your target return. Bidders who know this number walk away from bidding wars.
- How much leverage to use.A 20% down payment and a 40% down payment produce completely different ROI profiles on the same building. The right leverage depends on your target return, your tolerance for cash-flow risk, and your local lender's DSCR thresholds.
Forfirst-time buyers considering a house hack (renting spare rooms while living in the property), ROI reframes the whole purchase decision. You are no longer "buying a home" — you are underwriting a small business whose customer happens to be your housemate. Forlandlordsalready holding property, ROI on current equity often shocks: a property bought for $180,000 and now worth $450,000 with $360,000 of equity trapped in it might be earning a real ROI of only 3–4% on that equity, even if the cash flow feels great.
And for pure investors, ROI (particularly total ROI and IRR) is the language every institutional buyer speaks. Learning to compute it consistently is the difference between guessing and portfolio construction.
Educational, not personalised advice
Rules on tax deductions, depreciation, capital-gains treatment, and permitted leverage vary sharply by country, state, and personal circumstance. This article is educational only. Always verify country-specific rules with a licensed accountant, mortgage broker, and — where relevant — a lawyer before making a purchase decision.
Step-by-step: how to calculate rental property ROI
Every rigorous ROI calculation follows the same seven-step process, no matter the country or property type.
Step 1 — Establish total cash invested (the denominator)
This is more than the down payment. It includes every dollar of your own money that leaves your account before the tenant moves in:
- Down payment (typically 20–25% for investment properties in most Tier-1 markets)
- Closing costs (title, lender, appraisal, taxes — 2–5% of price in the US; 3–5% including stamp duty in the UK; 4% DLD fee in Dubai; 1.5–4% land transfer tax in Canadian provinces; 3–5.5% stamp duty in Australian states)
- Immediate repairs and light rehab
- Move-in reserve (2–6 months of expenses — a genuine business best practice)
Step 2 — Estimate realistic gross scheduled rent
Not the highest rent you have seen advertised — the rent you can actually collect month after month. Pull comparables from at least three sources (portals, letting agents, and local rental data) and adjust for seasonality. Subtract avacancy allowance of 5–10% (higher in student areas, near seasonal markets, and in single-family suburbs where turnover costs are high).
Step 3 — Build a complete operating expense schedule
Include, at minimum: property tax, buildings insurance (and landlord liability), HOA/strata/service charge, property management (typically 6–12% of collected rent + tenant-placement fee), general maintenance, and utilities you pay while vacant.
Step 4 — Provision capital reserves (CapEx)
Roofs, boilers, HVAC systems, water heaters, appliances, exterior paint — they all fail on a schedule. Set aside 5–10% of gross rent every month as a capital reserve. This is the single most-missed line item in beginner analyses and the single biggest driver of "why is my real ROI half of what I projected?"
Step 5 — Compute debt service
Use your quoted mortgage rate, term, and amortisation to compute the annual payment. Then split it into interest and principal — because principal paydown is not a cost, it isyou paying yourself. It reduces cash flow but adds to total ROI.
Step 6 — Compute the two ROIs
Cash-on-cash return uses only cash flow. Total ROI adds principal paydown and a conservative estimate of appreciation. Never use the market's ten-year appreciation rate as your assumption — use something you can defend at a lender's desk, typically 2–4% for stable Tier-1 markets.
Step 7 — Stress test
Rerun the whole calculation with (a) rates up 1.5 percentage points, (b) vacancy at 15%, (c) property tax reassessed 20% higher, (d) rent 10% lower. If the deal survives at least three of the four, it is real. If it falls apart on one, it is fragile — even if the base-case ROI looks great.

Three worked examples across Tier-1 markets
Example 1 — Suburban single-family rental, Columbus, Ohio (USA)
A three-bedroom, two-bath single-family home listed at $260,000. Verified market rent is $2,000/month. Financing is a 30-year fixed at 7.0% with 25% down (a common investment-property structure in mid-2026).
US Example — Columbus SFR, Year-1 Numbers
Cash-on-cash return:−$1,410 ÷ $80,300 =−1.8%. This deal loses money on paper in year one at 7% financing.
Total ROI: (−$1,410 + $1,980 + $7,800) ÷ $80,300 =+10.4%. Once principal paydown and modest appreciation are added, the same deal is respectable.
The tension in this example is the entire reason ROI has multiple definitions. Cash-on-cash tells the truth about what the property does this year. Total ROI tells the truth about what it does for your net worth. Both are real; neither is complete on its own.
A subtle but important nuance: the appreciation number in this example (3%) is deliberately conservative for a Midwest US market. Push the assumption to 5% — which many Columbus buyers were quoting in 2021–2022 — and total ROI jumps to 13%. Cut it to 1% (a realistic recessionary scenario) and total ROI drops to 3.5%, barely beating a savings account. This sensitivity is exactly why the stress test in step seven matters so much: your ROI number is only as trustworthy as the weakest input feeding it. Serious investors run three scenarios (bear, base, bull) on every deal and only proceed when the bear case still exceeds their opportunity cost.
Example 2 — Two-bed buy-to-let flat, Manchester (UK)
Purchase price £210,000, market rent £1,200/month, 25-year interest-only buy-to-let mortgage at 5.6% with 25% deposit — a common UK BTL structure. Stamp duty is calculated on a second-home basis.
UK Example — Manchester BTL Flat, Year-1 Numbers
Interest-only mortgage (5.6% on £157,500)
Cash-on-cash return: £300 ÷ £64,500 = 0.5%. Effectively break-even.
Total ROI: (£300 + £0 + £5,250) ÷ £64,500 = 8.6%. All the return is riding on appreciation because interest-only mortgages have no principal component. See our guide on Interest-Only Mortgages Explainedfor the risk/reward picture on this popular UK structure.
This example illustrates a UK-specific quirk that catches out international investors: the interest-only structure means the mortgage balance never falls for the entire term. There is no principal component to add to total ROI, so the property must appreciate for the deal to work at all. If UK house prices are flat for five years — which they were, on a real basis, for much of the mid-2010s — the investor has earned virtually nothing on a £64,500 commitment, and paid £44,100 in mortgage interest along the way. The 2020 changes to Section 24 (removing mortgage interest as a deductible expense for individual landlords) tighten the squeeze further; many UK BTL investors now hold through a limited company to preserve deductibility, which brings its own corporation-tax and dividend-extraction considerations.
Example 3 — 1-bedroom apartment, Dubai Marina (UAE)
Purchase price AED 1,200,000, market rent AED 90,000/year, 20% down payment for non-resident buyers, 25-year mortgage at 5.99%, plus Dubai Land Department (DLD) fee of 4%.
UAE Example — Dubai Marina 1BR, Year-1 Numbers
Cash-on-cash return:−14,250 ÷ 354,000 =−4.0%.
Total ROI: (−14,250 + 15,600 + 48,000) ÷ 354,000 =+14.0%.
Dubai illustrates something Tier-1 investors need to understand deeply: headline gross yields (7.5% here) are dramatically compressed by service charges and financing. The property still produces a strong total ROI, but only because of appreciation and principal paydown — the current cash flow is negative. A buyer relying on the headline yield alone would be blindsided.
Example 4 — Investment townhouse, Brisbane (Australia)
An investor-grade three-bedroom townhouse in an outer-ring Brisbane suburb priced at AUD 780,000, renting at AUD 620/week (approximately AUD 32,240/year). A 25-year principal-and-interest investor loan at 6.44% with a 20% deposit is a fair 2026 baseline. Queensland charges transfer duty (stamp duty) on investment purchases, and the state applies land tax above a threshold.
Australia Example — Brisbane Townhouse, Year-1 Numbers
Depreciation tax shield (illustrative, 30% marginal)
Cash-on-cash return:−23,620 ÷ 194,000 =−12.2%pre-tax. Deeply negatively geared.
Total ROI (with tax shield): (−23,620 + 7,900 + 31,200 + 3,500) ÷ 194,000 =+9.8%.
Brisbane is the textbook case for negative gearing. The property loses roughly AUD 23,620 per year on a cash basis — a real shortfall the investor must fund from other income. However, Australian tax law allows that loss (plus depreciation on the building and fixtures) to offset the investor's other taxable income, materially reducing the true after-tax cost. Combined with appreciation and principal paydown, the deal produces a healthy total ROI. This structure works only for high-income earners with genuine capacity to fund the shortfall for years, and it collapses instantly if appreciation stalls. It is also politically contested — proposals to limit negative gearing surface at almost every Australian federal election, and any change would materially reprice the market.
Best practice: always present two ROIs
Report cash-on-cash and total ROI together on every analysis. If the two disagree wildly, the deal is almost certainly a bet on appreciation — which is a legitimate strategy, but one you should make consciously, not by accident.
The costs investors quietly forget
Every underperforming rental in a Tier-1 market has the same root cause: a spreadsheet that was too optimistic on expenses. Here is the full list of line items that get skipped — check each one against your own analysis.
Ten commonly forgotten costs in rental property ROI analyses
Feels like a "someday" cost, not this month's cost
Owners assume back-to-back tenancies forever
Required when down payment is under 20–25%
Varies (UK, some US states, Australian states)
UAE service charges can exceed 20% of rent
The "8% headline" often hides 3–4% of extras
UK: gas, electric, EPC. AU: smoke alarms.
The 50% rule stress test
A well-known rule of thumb among experienced landlords: over a long enough horizon, non-mortgage operating expenses tend to average around 50% of gross rent. If your spreadsheet shows less than 35%, you have probably missed something. Rerun with 50% and see whether the deal still works.
Tier-1 market nuances — where ROI math bends
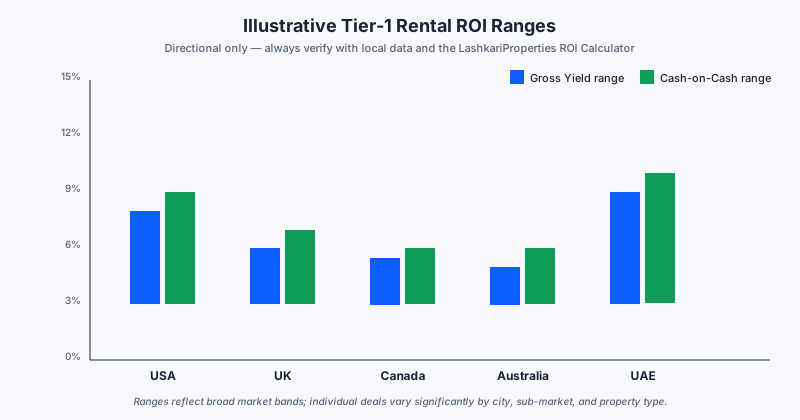
The same formulas apply everywhere, but the inputs — and the tax and legal wrapper around them — vary a lot. Here is a directional summary. Always verify with local professionals before acting on any specific number.
USA
The widest range of any Tier-1 market. Coastal metros (San Francisco, NYC, Seattle) rarely clear 4% gross yield; Midwest markets (Cleveland, Indianapolis, Kansas City) routinely offer 7–9% gross yield with double-digit cash-on-cash returns after leverage. The Federal Housing Finance Agency and Freddie Mac publish house-price indices that are useful sanity checks on appreciation assumptions. Depreciation over 27.5 years is a meaningful tax benefit that materially improves after-tax total ROI for many owners.
Buy-to-let dominates. Post-2020 tax changes eliminated most of the mortgage interest deduction for individual landlords held outside a limited company, which has pushed many portfolio investors into corporate structures. Gross yields cluster 4–6% (higher north of Birmingham, lower in London). Stamp duty on a second property is materially higher than on a primary residence. Ground rent and service charges on leasehold flats can dwarf small ROI improvements — always read the lease.
Canada
Traditionally a capital-growth market with low cash-flow. Toronto and Vancouver often show sub-4% gross yields. Rent controls in Ontario and British Columbia limit growth on existing tenancies. Foreign-buyer restrictions and prohibitions have shifted some capital to secondary markets (Halifax, Calgary, London ON) where yields are higher. Depreciation via Capital Cost Allowance offers useful tax deferral but recaptures on sale — factor this into total ROI.
Australia
Sydney and Melbourne have long been low-yield, high-growth markets (2.5–4% gross). Perth and Brisbane offer higher yields. Negative gearing — the ability to offset rental losses against other taxable income — is a defining feature of the Australian investor landscape and materially improves after-tax total ROI for higher-income landlords. State-level stamp duty and land tax vary enough that identical properties in different states can have very different net returns.
UAE
Dubai and Abu Dhabi combine high gross yields with steep service charges. The DLD 4% fee is a real cash cost at purchase and should always be in the denominator. There is no personal income tax on rental income, which materially improves cash flow versus other Tier-1 markets — but VAT on some services, cooling charges, and the volatility of the off-plan/handover market are real risks. A 10-year rental cap and rent-index mechanism affect renewal pricing.
Currency and interest-rate risk
If you are buying in a country where you do not earn your income, ROI in local currency and ROI in your home currency can diverge sharply over a hold period. A 12% AED total ROI can become a 4% USD total ROI if the dirham weakens (or vice versa). Institutional investors hedge; retail investors usually ignore this risk to their cost.
Common mistakes and myths
Myth 1 — "If the rent covers the mortgage, it's a good deal"
The mortgage payment is one of many costs. A property that covers its mortgage but not its taxes, insurance, management, vacancy, and CapEx reserves is losing money — you just cannot see it until the boiler fails.
Myth 2 — "Appreciation is guaranteed in [big city]"
The very definition of a bubble is a market where appreciation is treated as risk-free. Every Tier-1 market has experienced meaningful drawdowns in the last 25 years. Bake in a conservative appreciation assumption (2–4% for stable markets) and check the deal still works.
Myth 3 — "I will manage it myself, so I don't need to include management fees"
If you self-manage, you are choosing to work for the property. That has a real cost — your time. Include a full management fee in the analysis anyway; then the property is buyable regardless of whether you get tired of self-managing five years in.
Myth 4 — "ROI on my down payment is what matters"
Only in year one. As equity builds — through paydown and appreciation — ROI on current equity becomes the honest number. Long-held properties often show declining ROI even as absolute cash flow grows. This is why experienced investors refinance, cash out, or 1031/like-kind exchange periodically.
Myth 5 — "The 1% rule always works"
The 1% rule (monthly rent ≥ 1% of price) worked in a low-rate era. At 7%+ US mortgage rates in 2026, deals clearing 1% often exist only in higher-vacancy, higher-CapEx markets where the rule was designed to compensate. It is a screening heuristic, not a decision rule.
Myth 6 — "Cash flow is the only thing that matters"
An equally common overcorrection. Cash flow matters because it lets you survive vacancies, rate resets, and reassessments. But if you optimise purely for year-one cash flow, you will systematically miss the appreciation-heavy markets that build the biggest long-term portfolios. Report both, weigh both, choose consciously.
Myth 7 — "Rate increases can't hit me because I'm on a fixed rate"
Fixed does not mean permanent. In the UK, buy-to-let fixes are typically 2 or 5 years, then revert to a much higher variable rate. Canada's five-year term is standard even on "fixed" mortgages, so refinancing at prevailing rates is inevitable. Australian fixed terms are typically 1–5 years. Even US 30-year fixed mortgages, though genuinely long-term, can trap owners in properties they cannot refinance if rates rise and their debt-to-income ratios shift. Always model your ROI at the rate you will actually pay in year six, not the teaser rate you locked in year one.
Myth 8 — "I can just raise rent to cover higher costs"
Rental markets are constrained by tenant incomes and local competition. Rent controls in Ontario, British Columbia, New York, California, Berlin, Vienna, and increasingly parts of Australia and the UK limit annual increases on sitting tenants. Even in unregulated markets, rent growth rarely tracks the pace of tax reassessments, insurance premium spikes, and interest-rate resets. Model your ROI assuming rent grows at general inflation (2–3%) and costs grow slightly faster — because that is what usually happens.
How ROI connects to related property metrics
No single number is enough. Understanding how ROI relates to its cousins prevents the common failure of over-optimising one metric while ignoring the picture around it.

ROI vs cap rate
Cap rate is unlevered — it asks what the property yields regardless of financing. ROI is levered — it asks what your money earns given your specific loan. For comparing two markets or two asset classes, cap rate is the honest number. For comparing two deals for you specifically, ROI is the honest number. Deep dive: Cap Rate vs Cash Flow: Which Metric Should Guide Your Decision?
ROI vs rental yield
Rental yield is a subset of ROI, ignoring financing, tax, appreciation, and principal paydown. It is the least informative of the family — useful as a first screen only.
ROI vs DSCR
Debt Service Coverage Ratio (DSCR) is what commercial and portfolio lenders actually underwrite to. It answers: does the property's NOI cover its debt service by enough margin? A property can have great ROI and still be un-financeable if DSCR is under 1.20. See our DSCR Explainedguide.
ROI vs IRR
ROI is a snapshot; IRR is a movie. For a five-year hold with a planned refinance in year two and a sale in year five, IRR captures the full timing of cash flows in a way annual ROI cannot. Any hold longer than three years should include an IRR calculation as a sanity check.
ROI vs equity multiple
The equity multiple is total cash returned divided by total cash invested over the full hold — a 2.5x multiple means every dollar in came back as $2.50. It is popular with syndication investors because it captures the absolute magnitude of returns in a way IRR does not. A deal can have a high IRR (fast return) but low multiple (small absolute gain), or vice versa. Together, IRR, equity multiple, and total ROI form the professional trio for evaluating multi-year holds.
ROI vs rent-to-value ratio
The rent-to-value ratio (monthly rent divided by property value) is the sibling of the 1% rule. Like gross yield, it ignores every real cost. It is included here only so you can recognise it as inadequate on its own — the moment you see an agent quote a rent-to-value ratio as evidence a deal "works," ask for the cash-on-cash and total ROI on the same building.
Advanced considerations for serious investors
How financing structure changes ROI
Two identical properties can produce total ROIs 400 basis points apart based purely on how the buyer financed them. The core drivers are (1) loan-to-value ratio, (2) amortisation vs interest-only, (3) fixed vs variable, and (4) recourse vs non-recourse. A conventional 30-year US fixed at 75% LTV is the highest-ROI structure for a stable single-family rental in most conditions because it maximises principal paydown while keeping payments predictable. A UK interest-only BTL at 75% LTV produces higher cash flow but zero equity build. A Canadian 25-year amortising loan renewed every five years introduces refinance risk that must be priced into the total-ROI assumption. A DSCR loan in the US often carries a higher rate but qualifies purely on the property's cash flow, letting portfolio investors scale without personal DTI constraints.
The refinance-and-hold engine
Long-term investors rarely hold the same loan for its entire term. A common pattern in the US and Canada: buy at 25% down, hold for 3–5 years while rent and value rise, then refinance to pull equity back out — often called BRRRR (Buy, Rehab, Rent, Refinance, Repeat). Modelled correctly, this can produce an infinite ROI in accounting terms because after a successful refinance the investor has zero of their own money left in the deal. In practice, it depends on genuine forced appreciation (not market appreciation) via rehabilitation, and refinances at underwriting standards you cannot control. Model conservatively.
Portfolio-level ROI
Individual-property ROI is the beginning, not the end. Serious investors track weighted-average ROI across the portfolio, cash-on-cash on total portfolio equity, and — critically — the tax-adjusted ROI at the household level. A single high-yielding property in the Midwest paired with an appreciating one in a coastal metro can produce a portfolio ROI that neither achieves alone, while diversifying the risk of any single market. Portfolio thinking also forces the question of concentration risk: five houses on the same street in the same suburb is not five deals — it is one deal, five times.
Currency-hedged ROI for cross-border investors
An investor in Singapore buying a Dubai apartment or a London flat is running two bets at once: the property performance and the currency. The Capital Gain Calculatorcan approximate the effect of a stable exchange rate, but for serious cross-border investors the correct treatment is to compute total ROI in the local (property) currency, then apply a scenario-based haircut for currency movement over the hold. A 10% GBP depreciation over five years is a plausible bear case for a USD-based investor buying UK BTL and materially changes the answer.
The opportunity-cost lens
ROI is only useful when compared to alternatives. If your rental produces 8% total ROI but a diversified equity index has historically returned 8–10% with no tenant calls, no boiler failures, and daily liquidity, the property is not obviously better. It might still be worth doing for leverage, tax treatment, or portfolio diversification — but the honest comparison forces the case to be made explicitly. Every serious ROI analysis should end with a one-line sanity check: is this number materially better than my next best option, adjusted for effort and risk?
Running the numbers with free LashkariProperties calculators
Everything above can be done by hand or in a spreadsheet — but consistency matters more than sophistication. Every analysis you run should use the same assumptions and produce the same set of outputs, or you will end up unconsciously comparing apples to oranges. That is what our free calculator suite is designed to prevent.
Which LashkariProperties calculator to use, and when
What total return can I expect over 5–10 years?
Does the property cash flow month by month?
A repeatable workflow: start with the ROI Calculatorto check whether the base case works at all, then move to the Cash Flow Calculatorto stress-test month-by-month during vacancies and rate resets, then the Investment Calculatorto project a five- or ten-year holding period, and finally the Capital Gain Calculatorto model the exit. Twenty minutes per deal is enough once you have the muscle memory.
Run your first deal in under 20 minutes
Free, no signup required. All four calculators work on mobile and desktop and use the same input schema so numbers flow between them.
The seven-step actionable framework
Print this and tape it to your monitor. It is the entire workflow in one page.
- Collect purchase inputs. Price, closing costs, rehab, reserves — every dollar out of pocket before tenant move-in.
- Estimate rent conservatively. Verified comparables from three sources, adjust for seasonality, subtract 5–10% vacancy.
- Build a full expense schedule. Every line item in the "forgotten costs" table above. If it feels excessive, you're doing it right.
- Provision CapEx reserves.5–10% of gross rent, non-negotiable.
- Compute debt service. Separate principal from interest — principal is not a cost.
- Report both ROIs. Cash-on-cash for reality, total ROI for wealth-building — every time.
- Stress test at four levels.+1.5% rate, +15% vacancy, +20% tax reassessment, −10% rent. Pass on 3 of 4, or walk.
Best practice
Keep a running spreadsheet of every deal you have analysed and passed on. Six months later, look at what those properties actually rented for and traded at. Calibrating your assumptions against real outcomes is the fastest way to become a better underwriter.
Frequently asked questions
There is no universal threshold, but many long-term investors target a cash-on-cash return of at least 6–8% in Tier-1 markets, with a positive total ROI of 10–15% once principal paydown and modest appreciation are included. High-yield markets like parts of the UAE and US Midwest can exceed these bands; capital-growth markets like London, Sydney, and Toronto often deliver less on cash flow but more on appreciation.
What is the difference between total ROI and cash-on-cash return?
Cash-on-cash return measures only the annual pre-tax cash flow divided by the cash you actually invested. Total ROI adds the other wealth drivers — mortgage principal paydown, appreciation, and (sometimes) tax benefits — to that same denominator. Cash-on-cash tells you what a property pays you today; total ROI tells you what it is really worth to your net worth over a year.
Which costs do investors most often forget when calculating ROI?
Capital expenditure reserves, realistic vacancy, property management (including tenant-placement fees), lender-mandated insurance/PMI/LMI, HOA/strata fees, tenant turnover costs, service charges (UAE), ground rent (UK), and rising property tax after reassessment. Missing even two of these can turn a projected 9% ROI into a real 3%.
Should I use gross yield or ROI to compare properties?
Gross yield is a quick screen — useful for shortlists. ROI is the decision-grade metric because it accounts for financing and expenses. An 8% gross-yield property can have negative ROI once real costs and mortgage service are included, while a 5% gross-yield property can have healthy 10%+ total ROI thanks to leverage and appreciation.
How does leverage affect rental property ROI?
Leverage multiplies both returns and risk. Because ROI divides by your invested cash (not the property price), a 25% down payment can turn a 4% asset yield into a 10–12% total ROI when appreciation and principal paydown are included. It also magnifies losses if rents drop, rates rise, or the property depreciates.
Is rental property ROI calculated before or after tax?
Standard cash-on-cash return is calculated pre-tax because tax outcomes vary widely. After-tax ROI is more accurate for personal decisions but requires knowing your marginal rate, allowable deductions (depreciation in USA, capital works in Australia), and treatment of losses (negative gearing rules). Start pre-tax, then run an after-tax version with a qualified local advisor.
In total ROI, yes — unrealised appreciation is included as an accrued gain because it grows your equity. But it is not cash. You cannot spend it without selling or refinancing, both of which have transaction costs and tax implications. Separate cash ROI (spendable) from paper ROI (equity growth) to avoid over-borrowing against a market that has not yet delivered a realised gain.
How do I calculate ROI for a property I already own?
Use current market value, not your original purchase price, as the equity base. True annual ROI is annual cash flow plus principal paydown plus year-over-year appreciation, divided by your current equity (market value minus loan balance). This is why long-held properties often show high absolute cash flow but declining ROI on equity — trapped equity might earn more elsewhere.
How does ROI differ across the USA, UK, Canada, Australia, and UAE?
USA offers the widest range: sub-4% yields in gateway cities and 8%+ in Midwest markets. The UK trends 4–6% gross with strong regional variation. Canada and Australia tend to be capital-growth markets with lower yields (3–5%) but strong appreciation. The UAE often shows headline gross yields of 6–9% but service charges, cooling fees, and DLD fees materially compress net ROI.
What is the 1% rule and should I still use it?
The 1% rule says monthly rent should be at least 1% of the purchase price. It was a workable US screen in the low-rate era; in 2026 few appreciating markets clear it. Treat it as a rough coastal-versus-Midwest screener, not a decision rule. A proper ROI calculation replaces it entirely.
How do I stress test a rental property ROI?
Run four scenarios: rates up 1.5 percentage points at refinance, vacancy at 15% for one year, property tax reassessed 20% higher after purchase, and a 10% rent cut. A deal that stays positive across at least three of the four is genuinely resilient. This is where acash-flow calculator earns its keep.
Is a rental property with negative cash flow ever worth buying?
Sometimes — but only with eyes open. In capital-growth markets like Sydney, Toronto, or central London, some investors accept mild negative cash flow ("negative gearing") on the thesis that appreciation and principal paydown will compensate. This works only when you can fund the shortfall for years, have tax rules that allow offsetting the loss, and the appreciation thesis is grounded in fundamentals — not hope.
Conclusion and next steps
ROI is not one number — it is a family of numbers, each of which answers a slightly different question. Cash-on-cash tells you what the property will pay you next year. Total ROI tells you what it is doing for your net worth. Cap rate lets you compare markets. IRR lets you compare deals over multi-year holds. Any single one, taken alone, will mislead you at some point.
The good news: the calculation is not complicated once you have the discipline to include every real cost, use conservative rent and appreciation assumptions, and stress test what you buy. Twenty minutes with a proper calculator, done consistently across every deal you look at, will make you a materially better investor than 95% of the buyers competing with you.
Three concrete next steps:
- Take a property you are actually considering — or one you already own — and run it through the ROI Calculatorusing the seven-step framework in this article.
- Read the companion guides: Cap Rate Explained,Cash-on-Cash Return, and DSCR Explained. Together they cover every metric a serious residential investor needs.
- Bookmark the full Investment Guideslibrary. It is designed to be a self-service curriculum, not a lead-gen funnel.
If you build one habit from this article, make it this: never quote an ROI number without immediately quoting the other one. Cash-on-cash and total ROI, always together. That single discipline will save you from more bad deals than any other rule of thumb in this business.
Ready to underwrite your next deal?
Every LashkariProperties calculator is free, needs no signup, and uses the same seven-step logic you have just learned.
Related guides you may enjoy
- Cap Rate Explained for Property Investors
- Cap Rate vs Cash Flow: Which Metric Should Guide Your Decision?
- Cash-on-Cash Return: How to Calculate It Properly
- Interest-Only Mortgages Explained: Risks, Uses, and Math
- DSCR Explained: The Investor Loan Metric That Matters
Disclaimer. This article is provided for general educational purposes only and does not constitute personalised financial, tax, legal, or investment advice. Property investment involves risk, including risk of loss of capital and rental income. Rules on lending, taxation, capital gains, depreciation, and landlord obligations vary by country, state, and personal circumstance and change over time. Numbers used in worked examples are illustrative only and do not reflect any specific property or transaction. Always consult a licensed local professional before making a purchase, financing, or tax decision. Past appreciation does not guarantee future returns. LashkariProperties and its authors accept no liability for decisions made in reliance on this article.
Sources
Related reading
Continue reading: Break-Even Occupancy for Landlords · How to Calculate Rental Yield (2026) · Cap Rate Explained for Investors. Run your own numbers with the Rental Cash Flow Calculator — it takes under a minute and beats guessing.
Frequently asked questions
How do you calculate ROI on a rental property?
ROI depends on which definition you use: gross yield, net yield, cash-on-cash return, or total return including appreciation. On a leveraged purchase, divide the annual net cash flow by your total cash invested for the honest levered number.
What is the difference between ROI and rental yield?
Yield divides rent by the property value, ignoring financing. ROI divides returns by the cash you actually invested, so a mortgage makes ROI higher (and riskier) than yield. Comparing an unlevered yield with a geared ROI is comparing different questions.
Which costs should ROI include?
All of them: deposit, purchase costs, refurbishment, voids, management, insurance, repairs, and tax. The ten costs most beginner analyses miss are exactly the ones that separate deals that pencil from deals that survive.
What is a realistic ROI target for a rental property?
Most landlords target 8 to 12 percent cash-on-cash return in normal markets, plus 2 to 4 percent annual appreciation. Markets with strong growth may justify accepting 5 to 6 percent, while value-add deals in secondary cities can push toward 15 percent. The honest benchmark is the stock market's long-run 7 to 10 percent total return — your property must beat that on a risk-adjusted basis, or you should question why you are tying up illiquid equity.