


SCOPE BANNER — This guide is an educational, pre-tax property-investment framework checked 23 August 2026. Examples are hypothetical USD/US, GBP/UK and AED/UAE planning cases; tax, lending, vacancy, legal and transaction rules vary by jurisdiction and lender. No figure is a quote, forecast or investment recommendation.
Byline and funding disclosure: Nirmal Lashkari is the editorial author of this property-tools guide; this byline is not a claim of regulated financial-adviser, tax or legal credentials. The examples were recomputed against the stated formulas and official source routes. No lender, agent, listing service or data sponsor paid for the examples, and no affiliate revenue is assumed from the linked tools.
Update cadence: this guide is manually reviewed when material rate, tax or lending rules change and was last checked on 23 August 2026. Calculator outputs are computed from the inputs a reader enters; they are not a live market-rate feed or a promise that external rules have refreshed automatically. Recheck official sources and local professionals before acting.
TL;DR: the three-minute NPV decision
- Positive NPV means the modelled cash flows exceed your written required return; negative NPV means they do not. Zero is the hurdle, not a guarantee of safety.
- Use one consistent lens: this guide uses equity-level NPV—deposit and acquisition costs at time zero, after-debt annual cash flow, and resale proceeds after selling costs and loan repayment.
- Run three cases before an offer: base, downside (rent growth −1 point, vacancy +2 points, exit −10%) and zero-growth. Then solve NPV = 0 to find the ceiling price.
- If the result depends on an aggressive resale assumption, an unverified rent or a discount rate below the financing cost, stop and verify the input rather than lowering the hurdle.
Editorial/commercial note: LashkariProperties' calculators and worked examples are provided for education. This page does not receive a lender, agent or listing-service promise on behalf of any example, and no affiliate relationship is assumed. Read the calculator methodology and assumptions page before relying on an output.
Five-minute NPV checklist before you offer
- Write the discount rate, alternative return and risk premium in one sentence; do not lower the hurdle just to make a preferred deal pass.
- Run base, downside and zero-growth cases using the same equity-level lens; record rent, vacancy, expenses, debt, tax and exit assumptions with dates.
- Solve NPV = 0 for a ceiling price and compare it with the asking price; treat the gap as your negotiation range, not as guaranteed value.
- Open the calculator methodology page, export the input/output data, and verify formulas, rounding, currency and tax treatment before relying on the result.
- Before committing, ask a local tax adviser, conveyancer or licensed lender which rules apply to the property, buyer and financing.
What is net present value in property investment?
A dollar, pound or dirham you receive today is worth more than the same amount received five years from now. That is not pessimism — it is arithmetic. Money in hand can be invested, it carries no risk of never arriving, and inflation steadily erodes what it can buy. Net present value (NPV) is the tool that converts every future cash flow a property will produce into its equivalent value today, so that a $5,000 rental surplus in year seven and a $190,000 resale in year ten can be compared, on the same terms, with the $85,000 you must part with on completion day.
The mechanics are simpler than the name suggests. Choose adiscount rate — your required annual return. Then shrink each future cash flow by that rate, once for every year you must wait to receive it. At an 8% discount rate, $10,000 arriving in one year is worth $9,259 today; arriving in five years, just $6,806. Add up all those shrunken values, subtract what the deal costs you upfront, and the remainder is the NPV.
The one-sentence rule
Positive NPV = the property beats your required return. Negative NPV = it falls short. Zero means it exactly matches your required return — neither creating nor destroying value for you.
Yield metrics — gross yield, net yield,capitalisation rate — compress a property into a single-year snapshot. They are excellent screening tools. But they cannot see the refurbishment you will fund in year two, the rent growth that compounds quietly for a decade, the mortgage balance you will have paid down, or the selling costs that will shave 7% off your exit. NPV sees all of it, because it models the entire life of the investment rather than its first impression.
That is why NPV sits at the centre of professional property analysis. Institutional investors, REIT analysts and development appraisers all run some form of discounted cash flow before committing capital. The free NPV calculator on LashkariProperties puts the same machinery in your hands — but to trust its output, you first need to understand what goes in. That is what the rest of this guide covers.
What NPV actually answers
In practice, investors use NPV to answer three distinct questions, and it is worth separating them now because the worked examples later return to each one:
- Should I buy at this price?— NPV above zero at your required return says yes; below zero says walk away or renegotiate.
- What is the maximum I should offer?— the breakeven price is the one where NPV equals zero. Everything below it is margin.
- Which of these three properties is best?— the deal with the highest NPV per dollar of capital deployed wins, even if its yield looks lower.
"Yield tells you what a property earns. NPV tells you what it is worth to you."
Key definitions and formulas
Five concepts do all the work in an NPV calculation. Get these right and the rest is arithmetic.
Net present value (NPV)
The sum of all future cash flows from an investment, each discounted to today's money, minus the initial outlay. In property, the cash flows are typically annual after-debt rental surpluses plus the net proceeds from selling at the end of the hold.
Discount rate (r)
Your required annual rate of return — the return this property must beat to justify tying up your capital. It is not an observed market number; it is a decision. Section 4 shows how to build one from a risk-free benchmark plus risk premiums.
Net operating income (NOI)
Effective rental income (market rent minus vacancy) minus operating expenses: management, maintenance, insurance, service charges, ground rent, letting and licensing. NOI excludes mortgage payments and income tax — those enter later, at the cash-flow stage.
Terminal value
The net cash you expect at exit: projected resale price, minus selling costs (agent fees, legal, exit taxes), minus the outstanding mortgage balance. Usually the largest single flow in the projection — and the most sensitive to your assumptions.
Internal rate of return (IRR)
The discount rate at which NPV equals zero. If a deal's IRR is 10.4% and your required return is 8%, the deal clears your hurdle with 2.4 percentage points of headroom.
The NPV formula, broken down
Two supporting formulas feed into it. First, the present value of any single future amount:
PV = CFt÷ (1 + r) t
Second, net cash flow in a leveraged deal:
CFt= NOIt− annual debt servicet
Worked micro-example: discounting $10,000
Before touching a full property model, watch what the discount rate does to a single payment of $10,000 as the waiting time stretches:
Present value of $10,000 received in future years, discounted at 8%
| Receipt year | Present value (USD) |
|---|---|
| 1 | $9,259.26 |
| 5 | $6,805.83 |
| 10 | $4,631.93 |
Notice the compounding bite: by year ten, less than half the value remains at an 8% rate. This is why the terminal value — usually arriving at the end of the hold — shrinks so dramatically, and why deals that depend almost entirely on a big resale number deserve extra scepticism. Matching arithmetic is shown in the formula table above; the full property model uses the same discounting rule.
Best practice: state your discount rate in writing
Before you run any numbers, write down your required return and why. "8%, because I can earn ~4% risk-free and this property's location, tenant profile and condition justify a 4-point premium." A stated hurdle stops you quietly lowering the rate until the deal you already want passes the test.
Why NPV matters for buyers, investors and landlords
Every property decision is ultimately a trade between money now and money later. The deposit and purchase costs leave your account this month; the rent, the loan paydown and the resale arrive over years. Any metric that ignores that timing gap will systematically favour deals with flashy early numbers and punish deals whose value builds slowly. NPV is the correction.
For investors: one number to rank competing deals
Suppose you are choosing between a high-yield flat in a flat-growth market and a lower-yield house in a strong-growth suburb. Yield alone crowns the flat. But if the house's rent grows 4% a year while the flat's service charge eats 2% more of its rent each year, and both are resold in a decade, the house can easily produce the higher NPV. Without discounting the full cash flow stream, you are comparing the wrong thing. NPV also handles the question yield can never touch: how much is this deal worth overpaying or underpaying by?The breakeven-price technique in Example 2 below turns NPV into a negotiating instrument.
For landlords: stress-testing before the rate rises
Existing landlords face NPV questions too: should I remortgage, refurbish, or sell? A refurbishment is itself a mini investment — an upfront cost followed by higher rent and a higher resale value. Discounting those incremental flows tells you whether the works create value at your required return, which a simple payback period (which ignores everything after breakeven) cannot.
For home buyers: the buy-versus-rent version
Owner-occupiers can run the identical logic by treating avoided rent as the property's cash inflow. The deposit and buying costs are C₀; each year the home "pays" you the rent you no longer hand to a landlord, plus net resale proceeds at the end. If that NPV is positive at your required return, buying beats renting-and-investing-the-deposit — before any emotional or lifestyle factors enter the picture.
What NPV does not capture
NPV prices timing, not everything. It cannot value the option to stay flexible, the forced-savings discipline of a mortgage, portfolio diversification, or regulatory shocks (rent caps, licensing changes, tax reform). Treat a positive NPV as a necessary condition for a good investment — never a sufficient one.
How to calculate NPV step by step
The full process takes about 30 minutes once you have your inputs. Work through it in order — each step builds the inputs the next one needs.
Step 1 — Estimate your total initial outlay (C₀)
C₀ is every dollar that leaves your pocket before the property earns anything. In a leveraged purchase that is the deposit (not the full price), plus acquisition costs: transfer taxes or stamp duty, legal and conveyancing fees, inspection and survey costs, loan arrangement fees, and any immediate refurbishment needed to make the property rentable. Cash buyers use the full price plus the same costs. A common error is forgetting the costs — at 5–8% of price in many markets, they alone can flip a marginal NPV negative.
Step 2 — Forecast net cash flow for each year
For each year of your planned hold, build the flow in layers:
- Gross rent — achievable market rent, evidenced by comparable listings, grown at a realistic rate (2.5–3.5% is a sober long-run assumption in most Tier-1 cities).
- Less vacancy — 4–8% depending on the market and tenant profile.
- Less operating expenses — management (8–10% of rent if outsourced), maintenance and repairs, insurance, service charges, ground rent, letting and licensing fees. This gives NOI.
- Less debt service — annual mortgage payments (or interest, on an interest-only loan). The result is your annual net cash flow.
Verify your per-year numbers against the free cash flow calculator — it applies the same rent → vacancy → expenses → debt structure and flags years where the property runs cash-negative.
Step 3 — Estimate the terminal value
Project the resale price at the end of the hold using a conservative appreciation rate, then deduct selling costs (agent commission, legal, marketing — typically 2–7% of price depending on country) and the remaining mortgage balance. Theproperty appreciation calculator compounds your growth assumption year by year so you can see how sensitive the exit figure is to a single percentage point.
Step 4 — Choose a discount rate
The discount rate is where NPV stops being arithmetic and becomes judgement. Build yours in three layers:
- Risk-free foundation — the yield on a 10-year government bond, or your central bank's policy rate as a rough proxy.
- Property risk premium — typically +2 to +4 percentage points for vacancy risk, maintenance surprises, tenant risk and market cyclicality. A tired flat with a short lease sits at the top of the range; a modern house in a supply-constrained suburb at the bottom.
- Illiquidity and effort premium — +0.5 to +1.5 points. Property takes months to sell and hours to manage; a passive index fund demands neither.
That build-up is a planning range, not a market fact: the right hurdle depends on the investor's alternative return, leverage, property risk, liquidity, management effort and tax basis. Use a dated government-bond or Treasury benchmark as the foundation, then add a written property/equity risk premium. Two sanity checks: a discount rate below the mortgage rate deserves a specific explanation, and a hurdle that does not reward illiquidity or effort may overstate the deal's value.
| Reference | Observed / linked evidence | How to use it |
|---|---|---|
| Freddie Mac PMMS | 30-year FRM average 6.66% on 30 July 2026; 6.65% on 20 August 2026 | U.S. national mortgage-rate context; not an investor quote |
| U.S. Treasury daily rates | Official daily Treasury rate and yield-curve dataset | Risk-free foundation reference; not the property discount rate |
| Property hurdle | Investor-specific required return | Add risk, leverage, liquidity, management and tax considerations; document the basis |
US mortgage pricing adds further context: the Freddie Mac PMMS archive lists the 30-year fixed national average at 6.66% on 30 July 2026, 6.69% on 6 August, 6.67% on 13 August and 6.65% on 20 August. The U.S. Treasury daily rate page supplies benchmark data. An investor financing at roughly 6.66% and discounting equity at 5% would be asserting the property is safer than the secured lender's observed market pricing — a red flag unless the model explains the basis.
Step 5 — Discount each cash flow to present value
For each year t, divide the cash flow by (1 + r) t. Do the same for the terminal value using n, the final year. Sum everything. This is mechanical — and exactly the arithmetic the NPV calculator performs instantly once you key in your flows and rate.
Step 6 — Subtract the outlay and decide
NPV = total present value − C₀. Read it like this:
- NPV > 0 — the deal beats your required return by that many dollars, in today's money. Proceed to due diligence.
- NPV ≈ 0 — you are paying full price for the return you require. No margin of safety; negotiate or demand better evidence for the assumptions.
- NPV < 0 — the deal fails at your hurdle. Either the price must fall, the cash flows must improve, or you walk away.
The negotiation move most buyers miss
Flip the equation: instead of asking "what is the NPV at the asking price?", ask "at what price is NPV exactly zero?" That breakeven figure is your ceiling offer — and it gives you a defensible, numbers-based anchor in negotiation. Example 2 walks through it with real figures.
Three worked examples
Theory only becomes useful when it survives contact with real numbers. The three deals below are deliberately different: a leveraged US rental that clears its hurdle comfortably, a UK buy-to-let that looks profitable on yield but fails at a 7% discount rate, and a cash-purchased Dubai studio where a headline 8% gross yield hides a weak risk-adjusted return. All figures are pre-tax, hypothetical and for education — your own numbers, taxes and financing will differ.
Assumptions in each example are illustrative, rounded to the nearest currency unit, and mathematically consistent. They are not market forecasts or recommendations.
SAFETY NOTE — Hypothetical USA/Ohio, pre-tax example. Verify state and local property-tax, landlord, financing and sale-cost rules with qualified professionals; the 6.75% rate, rent and expense inputs are not quotes.
Example 1 — Columbus, Ohio duplex: a leveraged 10-year hold (USA)
An investor is offered a duplex at $280,000. She plans 25% down, a 30-year fixed loan at an illustrative 6.75% rate and a 10-year hold. Freddie Mac's U.S. national PMMS average was 6.66% on 30 July 2026 and 6.65% on 20 August 2026; those survey figures provide context, not a quote for this property. Her required return is 8%.
Inputs
- Purchase price $280,000 · deposit $70,000 · closing costs (3%) $8,400 · immediate repairs $6,600 → C₀ = $85,000
- Loan $210,000 at 6.75% / 30 yr → payment $1,362/mo → debt service $16,345/yr
- Year-1 rent $2,400/mo ($28,800/yr), growing 3% · vacancy 6% · operating costs 38% of effective income, growing with rent
- Appreciation 3.5%/yr · selling costs 7% at exit
| Input | Value | Treatment |
|---|---|---|
| Initial outlay (C₀) | $85,000 | Deposit + closing costs + immediate repairs |
| Debt | $210,000 at 6.75% / 30 years | Annual payment included in cash flow; balance repaid at exit |
| Income assumptions | $2,400/month; 3% growth; 6% vacancy | Effective rent feeds NOI |
| Operating costs | 38% of effective income | Excludes debt service |
| Exit assumptions | 3.5% appreciation; 7% selling costs; year 10 | Net sale proceeds after selling costs and loan balance |
| Hurdle | 8% | Required equity return; sensitivity shown in chart |
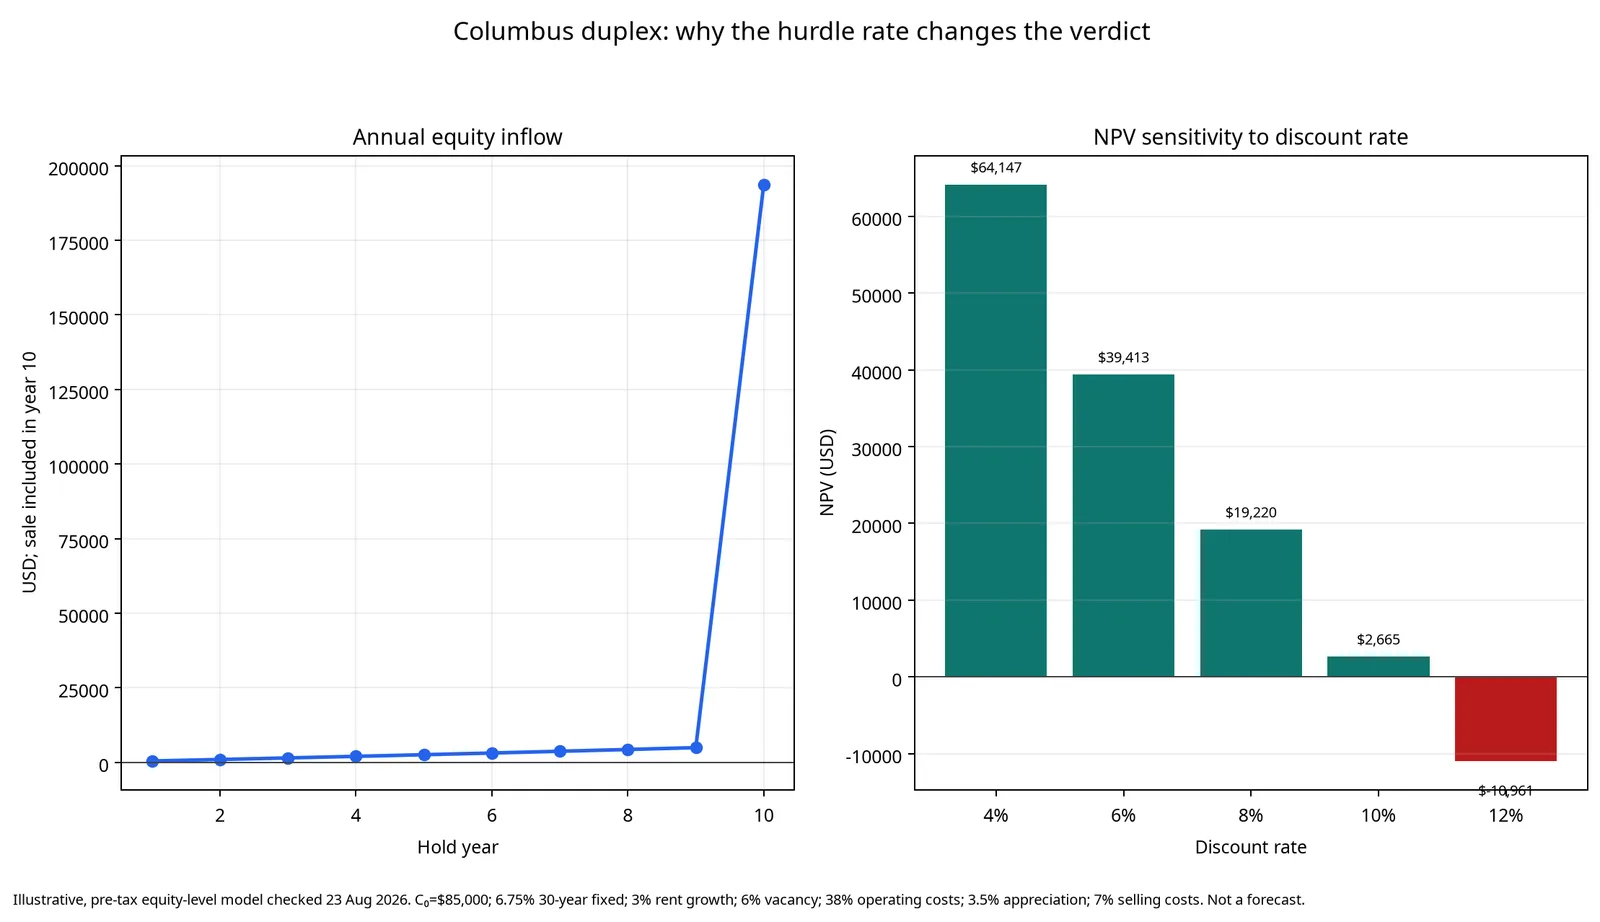
| Discount rate | NPV (USD) |
|---|---|
| 4% | $64,146.61 |
| 6% | $39,413.01 |
| 8% | $19,219.57 |
| 10% | $2,664.78 |
| 12% | −$10,961.37 |
Columbus duplex — 10-year cash flow projection (USD)
Terminal value. At 3.5% appreciation the duplex is worth $394,968 in year 10. Selling costs of 7% leave $367,320; the remaining loan balance is $179,132, so net equity proceeds are $188,188. Added to year-10 cash flow, the final-year inflow is $193,743.
Discounting at 8%.The ten annual surpluses are worth $17,052 in present value; the resale proceeds contribute $87,167. Total PV of inflows: $104,220. Against the $85,000 outlay:
NPV @ 8% = $104,220 − $85,000 =+$19,220
The deal creates roughly $19,000 of value beyond an 8% return — about 23% of the initial outlay. Its IRR is 10.4%, giving 2.4 points of headroom over the hurdle. Notice where the value lives: 84% of the PV comes from the resale. That is typical of leveraged US rentals with thin early cash flow, and it is exactly the kind of structural insight a year-1 yield (a cash-on-cash return of just 0.5% here) would never reveal — run this same profile through acash-on-cash return screen and the deal would look terrible, yet at the portfolio level it comfortably beats an 8% hurdle.
SAFETY NOTE — Hypothetical UK/England buy-to-let, pre-tax example. The £9,250 stamp-duty input is an illustrative 5% additional-dwelling assumption; check the current HMRC residential SDLT rates, property surcharge and personal tax position as of the transaction date.
Example 2 — Manchester flat: when a 6.8% yield still fails (UK)
A buy-to-let investor is offered a two-bed flat at £185,000 with a 6.8% gross yield — attractive by UK standards. He plans 25% down, an interest-only loan at 5.5%, and a 7-year hold. His hurdle:7%.
Inputs
- Deposit £46,250 · stamp duty at the 5% additional-dwelling band £9,250 · legal and fees £2,000 → C₀ = £57,500
- Interest-only loan £138,750 at 5.5% → interest £7,631/yr
- Rent £1,050/mo (£12,600/yr) growing 2.5% · vacancy 4% · service charge £1,800, ground rent £250, insurance £300, maintenance £800, licensing £150, management 10% of effective income — all growing 2.5%
- Appreciation 3%/yr · selling costs 2.5% · capital outstanding repaid at exit
Reproducibility export: download the Manchester annual cash-flow CSV. It contains gross rent, effective income, operating costs, NOI, interest-only debt service, net cash flow, sale equity and total inflow for each of the seven years, with the checked-date assumptions in the file header.
Year 1 looks passable on paper: effective income £12,096, operating costs £4,510, NOI £7,586 — but after £7,631 of interest, cash flow is−£45. By year 7, NOI has grown to £8,574 and cash flow turns positive at £943. At exit, the flat is worth £227,527; after 2.5% selling costs and repaying the £138,750 loan, equity proceeds are £83,088, making the year-7 inflow £84,031.
NPV @ 7% = £53,892 − £57,500 =−£3,608
Despite the respectable yield, the deal destroys £3,608 of value at a 7% hurdle. Its IRR is 6.0% — it only just clears a 6% rate (+£18). The culprits are the ones yield cannot see: £11,250 of acquisition friction, interest-only leverage that never amortises, and a service charge that quietly absorbs 15% of gross rent.
From verdict to negotiating position
Solving backwards, the price at which NPV equals zero at 7% is roughly £173,000 — about £12,000 below asking. Instead of walking away, the investor can anchor an offer at £173,000–176,000 with the calculation as justification, or pass entirely. This is the difference between NPV as a scorecard and NPV as a tool.
SAFETY NOTE — Hypothetical UAE/Dubai cash-purchase example, pre-tax. The 4% DLD and 2% agency inputs are illustrative planning assumptions; verify the current Dubai Land Department portal fees, trustee/admin charges, title status, service charge and sale costs for the specific property.
Example 3 — Dubai studio: an 8% gross yield, bought with cash (UAE)
A cash buyer is offered a studio at AED 650,000 with an advertised 8% gross yield. Dubai has no income tax on rent for individual landlords, which simplifies the projection — but transaction friction is front-loaded, with the Dubai Land Department fee and agency commission due at purchase.
Inputs
- Price AED 650,000 · DLD transfer fee (4%) AED 26,000 · agency fee (2%) AED 13,000 · trustee/admin ≈ AED 7,000 → C₀ = AED 696,000
- Rent AED 52,000/yr growing 2.5% · vacancy 5% · service charges AED 11,000, management 5% of effective income, maintenance AED 1,500 — growing ~2%
- Appreciation 3%/yr · selling costs 2% · 5-year hold · hurdle rate 8%
Reproducibility export: download the Dubai annual cash-flow CSV. It contains gross rent, effective income, service charges, management, maintenance, NOI, net cash flow, sale proceeds and total inflow for each of the five years, with the checked-date assumptions in the file header.
Year-1 NOI is AED 34,430 — a net yield of 4.95% on the all-in cost, far below the advertised 8% gross. By year 5 NOI reaches AED 38,272. The studio resells for AED 753,528; after 2% selling costs, net proceeds are AED 738,458, for a final-year inflow of AED 776,729.
Dubai studio — NPV by discount rate (AED)
The IRR is 6.3%. At an 8% hurdle the deal is nearly AED 49,000 underwater — and the breakeven purchase price works out to roughly AED 604,000, about AED 46,000 (7%) below asking. The advertised yield was never the deal's economics; it was the price'smarketing. A buyer who screened on gross yield alone would have overpaid by the price of a new car.
Worked examples are not advice
These scenarios are hypothetical and pre-tax. Stamp duty bands, service charges, landlord licensing, capital gains treatment and lending terms differ by country, state and personal circumstances, and they change. Verify every assumption locally and speak to a qualified tax adviser or conveyancer before committing capital.
Pre-tax NPV to after-tax NPV: the safe handoff
Use the pre-tax model for a common first screen, then build a separate after-tax version when tax materially changes the decision. Do not insert a guessed tax rate into every cash flow: taxable income, deductions, depreciation, interest treatment, ownership structure and capital-gains rules can differ even within a country. The safe formula is: after-tax cash flow = pre-tax cash flow − tax on the locally defined taxable base; after-tax exit proceeds = sale proceeds − selling costs − loan balance − applicable exit taxes.
| Market | Verify before changing the model | Primary route |
|---|---|---|
| USA | Rental-income expenses, depreciation, passive-activity limits and sale treatment; use property/state facts and a tax professional | IRS Publication 527 |
| UK | Property-income expenses, finance-cost treatment and SDLT/capital-gains position for the owner and property | HMRC Property Income Manual |
| Australia | Rental deductions, depreciation, ownership structure and capital-gains treatment | ATO rental property guidance |
| UAE/Dubai | Current transaction, service-charge, ownership and residency implications for the specific property; do not assume another country's tax treatment | Dubai Land Department portal and a local adviser |
Tier-1 market nuances that change the NPV math
The NPV formula is universal; its inputs are stubbornly local. The same spreadsheet structure produces very different answers once you feed it country-specific transaction costs, financing norms and tax settings. The differences below matter most.
How key NPV inputs differ across five Tier-1 markets (typical ranges — verify locally)
~2–5% closing costs; transfer tax varies by state
30-year fixed rates make debt service constant — projections are unusually stable; property tax varies widely by state and belongs in operating costs
Stamp duty land tax, with a 5% surcharge on additional dwellings (England/NI); different systems in Scotland and Wales
Leasehold flats carry ground rent and service charges that can escalate; interest-only buy-to-let loans keep capital outstanding to exit
Provincial land transfer tax; Toronto adds a municipal layer
Fixed rates typically reset every 5 years — model a re-fixing risk; lender stress tests constrain leverage rather than cash flow
State stamp duty (often 4–5.5%); no annual residential land tax for most investors at entry
Negative gearing makes after-tax NPV materially different from pre-tax for high earners; variable-rate loans dominate, so debt service is a forecast, not a constant
4% DLD transfer fee + ~2% agency + trustee fees
No income tax on rent for individuals simplifies flows, but service charges on apartments are high and the dirham's US-dollar peg ties local mortgage pricing to the Federal Reserve
Three cross-market lessons
Friction decides short holds. In the UK and UAE, round-trip transaction costs can reach 7–9% of price. At a 3-year hold, that friction alone often exceeds the entire discounted rental surplus — which is why short-hold strategies in high-friction markets need either strong appreciation or a below-market purchase to produce a positive NPV. Our Dubai example failed its hurdle on a 5-year hold partly for this reason.
Financing structure changes the shape of the cash flows, not just their size.A 30-year fixed US loan produces a flat debt-service line, so all the growth in the projection flows straight to equity cash flow. An interest-only UK buy-to-let keeps annual flows thin but leaves the full principal to be repaid at exit, shifting value into the terminal year — and the terminal year is the one the discount rate punishes hardest. Variable-rate Australian and Canadian loans add a third pattern: flows that must be stress-tested at +2 percentage points before the NPV means anything.
Tax settings decide whether pre-tax NPV is even the right screen. In the UAE, pre-tax and post-tax are nearly the same model for individual landlords. In the UK, mortgage interest relief is restricted to a basic-rate credit for individual landlords under rules detailed by HMRC, so higher-rate taxpayers can see a positive pre-tax NPV turn negative after tax. In Australia, negative gearing can push the after-tax NPV the other way. Always run both versions.
Best practice: keep the discount rate philosophy constant across countries
If you invest in more than one market, resist the temptation to give each country its own arbitrary hurdle. Use one consistent build-up — local risk-free rate plus your standard risk premiums — so a flat in Manchester and a studio in Dubai are ranked by the same yardstick. Varying the hurdle to suit each deal is how spreadsheets learn to agree with you.
Common mistakes and myths
Mistake 1 — Discounting at the mortgage rate
The mortgage rate is your lender's required return on a secured loan. Your equity sits behind that loan and absorbs the first losses, so it is riskier than the debt and must demand more. Discounting equity cash flows at the mortgage rate systematically overstates NPV. A defensible floor is your mortgage rate plus an equity risk premium.
Mistake 2 — Forgetting acquisition and exit costs
Stamp duty, legal fees, DLD fees and closing costs are real cash outflows at t= 0, and selling costs directly shrink the terminal value. Omitting both flatters the deal twice. In Example 2, the £11,250 of acquisition friction is roughly three times the NPV shortfall — ignoring it would have produced a "pass" on a deal that fails.
Mistake 3 — Double-counting or omitting the mortgage
Pick one lens and stay in it. The equity-level model used in this guide counts the deposit as the outlay and debt service as an annual cost, with the loan balance deducted from resale proceeds. The property-level model counts the full price as the outlay and uses pre-debt NOI throughout, discounted at a blended rate. Mixing the two — full price in C₀ and debt service in the flows — double-counts the loan and can make a sound deal look catastrophic.
Mistake 4 — Assuming rent and prices grow at the same rate forever
Optimistic compounding is the quietest way to fake a positive NPV. A 5% appreciation assumption over 10 years turns a $280,000 duplex into a $394,000 asset; at 2% it is $341,000 and the NPV roughly halves. Run the model at 0% growth. If the deal only works with generous appreciation, you are speculating on the exit, not investing in the cash flows.
Mistake 5 — Treating the projection as a forecast
A 10-year cash flow table is not a prediction; it is a set of hypotheses. The disciplined habit is sensitivity testing: vacancy +2 points, rent growth −1 point, interest +2 points, exit price −10%. A robust deal stays NPV-positive under modest stress. A fragile one needs every assumption to be right at once.
Myth — "A positive NPV guarantees a good investment"
NPV is only as honest as its inputs, and it prices timing, not everything else. It cannot see the problem tenant, the special levy, the rezoning, or the lender who declines your refinance. Positive NPV is the deal'sentry ticketto due diligence — not its certificate of quality.
Myth — "NPV is only for large commercial deals"
The arithmetic does not check the size of the cheque. A first-time buyer comparing a house purchase against renting is solving exactly the same discounted-cash-flow problem as a fund underwriting an office block — with avoided rent in place of market rent. Smaller deals deserve the same rigour because the investor behind them can usually afford less error.
How NPV connects to other property metrics — and when it beats simple yield
NPV does not replace the other metrics in your toolkit; it sits above them, consuming their outputs. Gross and net yield define the income line, cap rate anchors the valuation logic, cash-on-cash return and DSCR describe the financing, and NPV assembles all of it — plus time — into a single verdict.
NPV versus the other core property metrics
Sees only year 1; ignores growth, exit and financing
Pricing income-producing property against market comps
Annual cash flow relative to cash invested
Judging leverage and month-to-month affordability
Ignores appreciation and loan paydown entirely
Says nothing about whether equity earns its hurdle
Expressing the margin over your hurdle as a percentage
Scale-blind; can mislead on uneven or sign-changing flows
Final go/no-go, ranking competing deals, setting a ceiling offer
Only as good as its assumptions; needs a defensible discount rate
For a deeper treatment of how the two families of metrics interact in practice, see Cap Rate vs Cash Flow: Which Metric Should Guide Your Decision?
When simple yield is enough — and when it is not
Yield is the right tool at the top of the funnel: screening thirty listings down to three on a Sunday afternoon. It becomes the wrong tool the moment any of the following are true, and each one is a trigger to switch to NPV:
- You are comparing deals with different shapes — high-yield-flat-growth versus lower-yield-high-growth, or cash purchase versus leveraged purchase.
- The cash flows are uneven — a refurbishment year, a rent-free period, a lease renewal, staged repairs.
- The exit matters — a defined hold (5–10 years) rather than a perpetual buy-and-hold.
- Leverage is involved — yield ignores the mortgage; NPV prices its cost and its paydown. (If you are weighing an interest-only structure, read Interest-Only Mortgages Explainedalongside this guide — the loan type reshapes the whole projection.)
- You need a number to negotiate with — yield cannot tell you what to offer; the NPV= 0 breakeven price can.
The worked examples showed each trigger in action. Example 1: a 0.5% year-1 cash-on-cash return hid a deal worth +$19,220 at an 8% hurdle, because growth and amortisation compound quietly for a decade. Example 2: a 6.8% gross yield hid −£3,608, because friction and an unamortised loan ate the margin. Example 3: an 8% advertised yield hid −AED 48,968, because "yield on price" never saw the AED 46,000 of transaction costs and soft growth. Three markets, three different illusions — one corrective metric.
"Use yield to decide what deserves analysis. Use NPV to decide what deserves your money."
How to run the numbers with free calculators
Everything in this guide can be done by hand, but the arithmetic compounds quickly — a 10-year leveraged projection has thirty or forty moving parts. LashkariProperties is a free property-tools platform built for exactly this stage: verifying a deal's numbers before you buy, rent or invest. Four tools map directly onto the steps above:
- Cash flow calculator — builds Step 2. Enter rent, vacancy, operating costs and your loan terms; it produces the year-by-year NOI and after-debt cash flow lines that feed the projection, and highlights any cash-negative years you would need to fund from reserves.
- Property appreciation calculator — builds Step 3. Compound your growth assumption over the holding period to get the projected resale value, then test how a single point of growth (say 2.5% versus 3.5%) moves the terminal figure before you commit to it.
- NPV calculator — performs Steps 5 and 6. Feed it your initial outlay, annual cash flows, terminal proceeds and discount rate; it returns the NPV instantly, so you can iterate across discount rates and stress cases in seconds rather than rebuilding a spreadsheet each time.
- Investment calculator — the cross-check. It assembles yield, cash-on-cash return and total-return views of the same deal, so you can confirm that the story NPV tells is consistent with the simpler metrics — and see exactly where and why they disagree.
A practical workflow: screen on yield with the investment calculator, verify the income line with the cash flow calculator, pin down the exit with the appreciation calculator, then let the NPV calculator deliver the verdict at your stated hurdle. You can explore the full set on the tools page.
Best practice: stress-test in three passes, not one
Run the NPV three times at minimum — your base case; a downside case (rent growth −1 point, vacancy +2 points, exit −10%); and a zero-growth case. If the deal survives all three at your hurdle, the remaining risk is the kind no model can price. If it only survives the base case, the asking price — not the property — is the problem.
The NPV decision checklist
Work through this before every offer. Any box you cannot tick is an unanswered question — price it, evidence it, or walk.
- Outlay: C₀ includes deposit and all acquisition costs (transfer taxes, legal, inspection, loan fees, immediate works) — evidenced, not estimated from memory.
- Rent: year-1 rent is supported by at least three comparable current listings, not the agent's asking rent.
- Vacancy: an explicit allowance (4–8%) is deducted, matched to the local market and tenant profile.
- Expenses: management, maintenance, insurance, service charges, ground rent, licensing and letting fees are all itemised — with quotes or statements where they exist.
- Debt: annual debt service uses the actual quoted rate and term; variable-rate loans are also stress-tested at +2 points.
- Exit: resale assumes a conservative appreciation rate, deducts selling costs, and repays the modelled loan balance — and you have checked the deal at 0% growth.
- Hurdle: your discount rate is written down, built from a risk-free benchmark plus risk and illiquidity premiums, and sits above your mortgage rate.
- Verdict: NPV is positive at your hurdle and under the downside case; the breakeven price is known and shapes your offer.
- Cross-check: IRR exceeds the hurdle with headroom, and the simpler metrics (yield, cash-on-cash, DSCR) tell a consistent story — or you can explain precisely why they do not.
- Verification: tax, lending and legal assumptions have been checked with a local professional in the relevant country or state.
Frequently asked questions
Net present value (NPV) is the sum of every future cash flow a property is expected to produce — rental surpluses and resale proceeds — each converted into today's money at a chosen discount rate, minus the cash you invest upfront. A positive NPV means the deal earns more than your required rate of return; a negative NPV means it falls short.
What is a good NPV for a rental property?
Any NPV above zero at your chosen discount rate means the property beats your required return, so zero is the pass/fail line rather than a specific dollar figure. In practice, investors look for a comfortable positive margin — often 5–10% of the initial outlay or more — so the deal still clears its hurdle if rents slip or costs rise. Bigger is better only when comparing deals of similar size and risk.
How do you calculate NPV for an investment property?
Add up your initial outlay (deposit plus purchase costs). Forecast each year's after-debt cash flow and the net resale proceeds at the end of the hold. Pick a discount rate. Divide each cash flow by (1 + r) raised to the year number, sum the results, and subtract the initial outlay. A free NPV calculatorautomates the arithmetic once you have the inputs.
What discount rate should I use for property NPV?
Build it from three parts: a risk-free rate (a 10-year government bond yield, roughly 3–5% across Tier-1 markets in mid-2026), plus 2–4 percentage points for property-specific risk, plus 0.5–1.5 points for illiquidity and management effort. That lands most residential investors in a 7–10% range. As a sanity check, your discount rate should normally sit above your mortgage rate.
What is the difference between NPV and IRR?
NPV is a currency amount: the value a deal creates above your required return. IRR is a percentage: the discount rate at which NPV equals zero. IRR is intuitive but can mislead when deals differ in size or when cash flows change sign more than once; NPV measures value created in absolute terms. Used together, IRR tells you the margin on your hurdle and NPV tells you what that margin is worth in money.
Why is NPV better than rental yield for comparing properties?
Rental yield is a single-year ratio that ignores when money arrives. NPV accounts for the full holding period: rent growth, expense inflation, the mortgage paydown, refurbishment years and the resale. Two properties with identical yields can have very different NPVs if one grows faster, needs capital works, or is resold in a stronger market. Yield screens deals; NPV ranks them.
In the standard equity-level approach, yes. Your initial outlay is the deposit plus purchase costs, not the full price, and each year's cash flow is net operating income minus debt service. The resale proceeds are reduced by the outstanding loan balance. The mortgage is never double-counted: the borrowed principal is excluded from the initial outlay precisely because repayments appear in the annual flows.
What is a terminal value in property NPV?
Terminal value is the net cash you expect to receive when you sell: the projected resale price minus selling costs (agent fees, legal costs and any exit taxes) and minus the remaining mortgage balance. Because it is usually the largest single cash flow in the projection, conservative appreciation assumptions matter — test the deal at zero growth before relying on a favourable number.
Should I include taxes in a property NPV calculation?
Yes, wherever they are material and predictable: purchase taxes such as stamp duty or transfer tax belong in the initial outlay, income tax on rent reduces annual cash flow, and capital gains tax reduces terminal proceeds. Because tax treatment is personal and changes between countries and states, run a pre-tax NPV for screening and a post-tax version with a local accountant before committing.
Can NPV be negative even if a property has a good yield?
Yes. A high yield on the purchase price can still produce a negative NPV once acquisition costs, weak rent growth, heavy service charges, an expensive resale or a demanding discount rate are included. This happens most often with leasehold flats with rising charges, off-plan purchases priced above comparable resales, and markets where capital growth is flat.
How many years should I project when calculating NPV?
Match the projection to your realistic holding period — typically 5 to 10 years for residential property. Shorter holds make the answer sensitive to resale timing and transaction costs; longer holds dilute accuracy because distant cash flows are both heavily discounted and harder to forecast. Avoid projecting 20–30 years: the model gains false precision while the assumptions become guesswork.
Is NPV useful for home buyers, not just investors?
Yes, with an adjustment. An owner-occupier can treat avoided rent as the property's cash inflow, add expected resale proceeds, and discount both against the deposit and buying costs. The resulting NPV shows whether buying beats renting plus investing the deposit elsewhere at the chosen rate. It is the same logic investors use, with imputed rent replacing market rent.
Conclusion: one number, used three ways
Net present value does not ask you to predict the future — it asks you to price it honestly. Take the cash a property will realistically put in your pocket each year, take the net proceeds when you sell, shrink both by a required return you have actually thought about, and compare the total against what the deal costs you today. What survives that process is an investment. What does not was only ever a listing.
Used well, NPV works for you three times over: as a verdict (positive or negative at your hurdle), as a ranking (which of three competing deals creates the most value per dollar deployed), and as anegotiating anchor (the breakeven price at which NPV equals zero is your ceiling offer). Simple yield remains your screening tool — but the moment financing, growth, uneven cash flows or a defined exit enter the picture, discounting is the only honest way to compare.
The three worked examples showed why: a 0.5% cash-on-cash duplex worth +$19,220; a 6.8%-yield flat worth −£3,608; an 8%-yield studio worth −AED 48,968. In each case the headline number and the value were telling different stories, and only the discounted projection could see it.
Run your own deal through the numbers
Before your next offer, verify the projection with LashkariProperties' free tools — it takes minutes and costs nothing. Each calculator is intended to show its inputs and formulas; use the methodology page for currency, tax treatment, rounding, formula and equity-level versus property-level assumptions, and export the results before you rely on them:
Keep reading: Cap Rate vs Cash Flow·Cash-on-Cash Return: How to Calculate It Properly· browse all Investment Guides
Educational disclaimer: This guide is general education, not personalised financial, tax or legal advice, and it does not promise any investment outcome. Property transaction costs, taxes, lending rules and rates differ by country, state and personal circumstances and change over time — verify the rules that apply to you with qualified local professionals before acting.
About the LashkariProperties Research Team
Our analysts write the Investment Guides series and maintain the free calculators on LashkariProperties. Every worked example is recomputed and cross-checked before publication, and guides are refreshed as market rates and rules change. This article was last reviewed on 23 August 2026. Examples are educational, pre-tax and not a promise of returns.
Related guides and tools
Cap Rate Explained for Property Investors
The valuation metric NPV builds on — when cap rates price a deal and when they mislead.
DSCR Explained: The Investor Loan Metric That Matters
How lenders judge the same cash flows your NPV model projects.
Interest-Only Mortgages Explained: Risks, Uses, and Math
The financing structure behind Example 2 — and what it does to terminal value.
Yield, cash-on-cash and total return in one view — the cross-check for your NPV verdict.
Sources and check dates
- [1] Freddie Mac — Primary Mortgage Market Survey archive — official 2026 weekly U.S. mortgage-rate series; 30-year FRM 6.66% on 30 July and 6.65% on 20 August 2026; checked 23 August 2026.
- [2] U.S. Department of the Treasury — Daily Treasury Rates — official daily Treasury bill/yield-curve data and methodology links; checked 23 August 2026.
- [3] LashkariProperties — methodology — calculator/formula and editorial methodology route; checked 23 August 2026.
- [4] HMRC — Property Income Manual — UK property-income tax guidance route; personal tax treatment must be checked locally; checked 23 August 2026.
- [5] HMRC — Stamp Duty Land Tax residential rates — UK transaction-tax route; the worked UK figures remain hypothetical and should not be treated as current tax quotes; checked 23 August 2026.
- [6] Dubai Land Department — official portal — UAE transaction and registration route; Dubai fees and project rules must be confirmed for the property; checked 23 August 2026.
- [7] IRS — Publication 527 Residential Rental Property — U.S. rental-income/expense tax reference; examples are pre-tax and not personal tax advice; checked 23 August 2026.
Related reading
Continue reading: Break-Even Occupancy for Landlords · How to Calculate Rental Yield (2026) · Cap Rate Explained for Investors. Run your own numbers with the Rental Cash Flow Calculator — it takes under a minute and beats guessing.
Frequently asked questions
What is net present value in property?
NPV discounts every future cash flow of an investment back to today's money using your required return. A positive NPV means the property beats your required return; negative means it falls short, and zero means it exactly matches.
How do I use NPV for a property purchase?
List the cash flows — purchase cost, net rent each year, refurbishments, and the eventual sale — and discount each by your required annual return. NPV then decides whether the deal beats the alternatives, which single-year yields cannot see.
What discount rate should I use?
Use your required return or the yield on a comparable alternative investment, not a guessed number. At an 8 percent rate, money received in five years is worth far less today, so the discount rate is the whole game.
What discount rate should you use for a property NPV?
Use your required return — the rate that compensates you for risk and makes the deal worth doing. A common starting point is a 6 to 10 percent discount rate for residential rentals, rising to 12 to 15 percent for value-add or commercial deals. The best anchor is what you could earn elsewhere: if bonds pay 4.5 percent and you want 3 points of illiquidity premium, discount at 7.5 percent. A project with NPV of zero at your chosen rate is exactly as attractive as your alternative.