 By Nirmal Lashkari · Founder · Indore, Madhya Pradesh, India
$100,000 invested upfront, generating $9,000 annually for 10 years plus $150,000 in sale proceeds at an 8% discount rate, produces an estimated net present value of $29,869.76. The result comprises $60,390.73 of discounted annual cash flows and $69,479.02 of discounted sale proceeds, less the initial investment.
Your equity released when you sell at the end.
Assessment
Beats your target return
Net present value: $29,869.76
A positive NPV means the investment is expected to earn more than your discount rate.

Net present value, or NPV, converts a stream of future money into a value stated today. The calculator begins with an initial investment, discounts the annual net cash flow over the holding period, discounts the estimated net sale proceeds at the end, and subtracts the upfront investment. Its headline result is therefore not a future balance or a simple profit total. It is the surplus or shortfall after recognizing that money received later is worth less than money available now at the selected discount rate.
The tool also displays the two positive building blocks separately: the present value of cash flows and the present value of sale proceeds. That split is useful when an apparently attractive result depends mainly on a distant sale. The assessment then classifies the result as beating, meeting, or falling short of the target return. Read that label together with the NPV amount rather than treating it as a guarantee of performance.
Initial investment is the upfront amount committed at time zero. The component labels it in dollars and does not allow a value below zero. Include the amount that actually leaves your hands for the opportunity being tested; do not quietly mix future operating costs into this field when those costs are already reflected in annual net cash flow.
Annual net cash flow is the recurring yearly amount expected after the costs represented in your model. It may be positive or negative depending on the component's numeric behavior, so use a consistent convention across periods. Holding period is measured in years and must be at least one. Discount rate is entered as a percentage, accepts half-point steps, and represents the return threshold used to translate future amounts into present dollars.
Estimated net sale proceeds is the final amount expected to be released when the asset or project is sold. The component's hint calls this equity released at sale. Treat it as net proceeds rather than a gross headline sale price: if your own forecast includes selling costs, debt payoff, or other deductions, those belong in the estimate before entry. The calculator does not ask for a separate sale year because it assumes the exit occurs at the end of the holding period.
For a constant annual cash flow, the underlying structure can be expressed as NPV = −initial investment + annual cash flow × the present-value factor for the chosen years and discount rate + exit value ÷ (1 + discount rate)^years. The exact implementation is represented by the calculator function, while the practical meaning is straightforward: increasing the discount rate lowers the present value of distant receipts, and extending the holding period gives more time for recurring cash flow but also pushes the exit farther away.
This timing distinction explains why a $150,000 sale proceeds estimate is not added at face value when the sale occurs ten years from now. At an 8% discount rate, its present value is about $69,502 before considering any annual cash flows. A recurring cash flow is discounted period by period, so the output rewards dependable earlier receipts more than an equally sized amount that arrives only at exit.
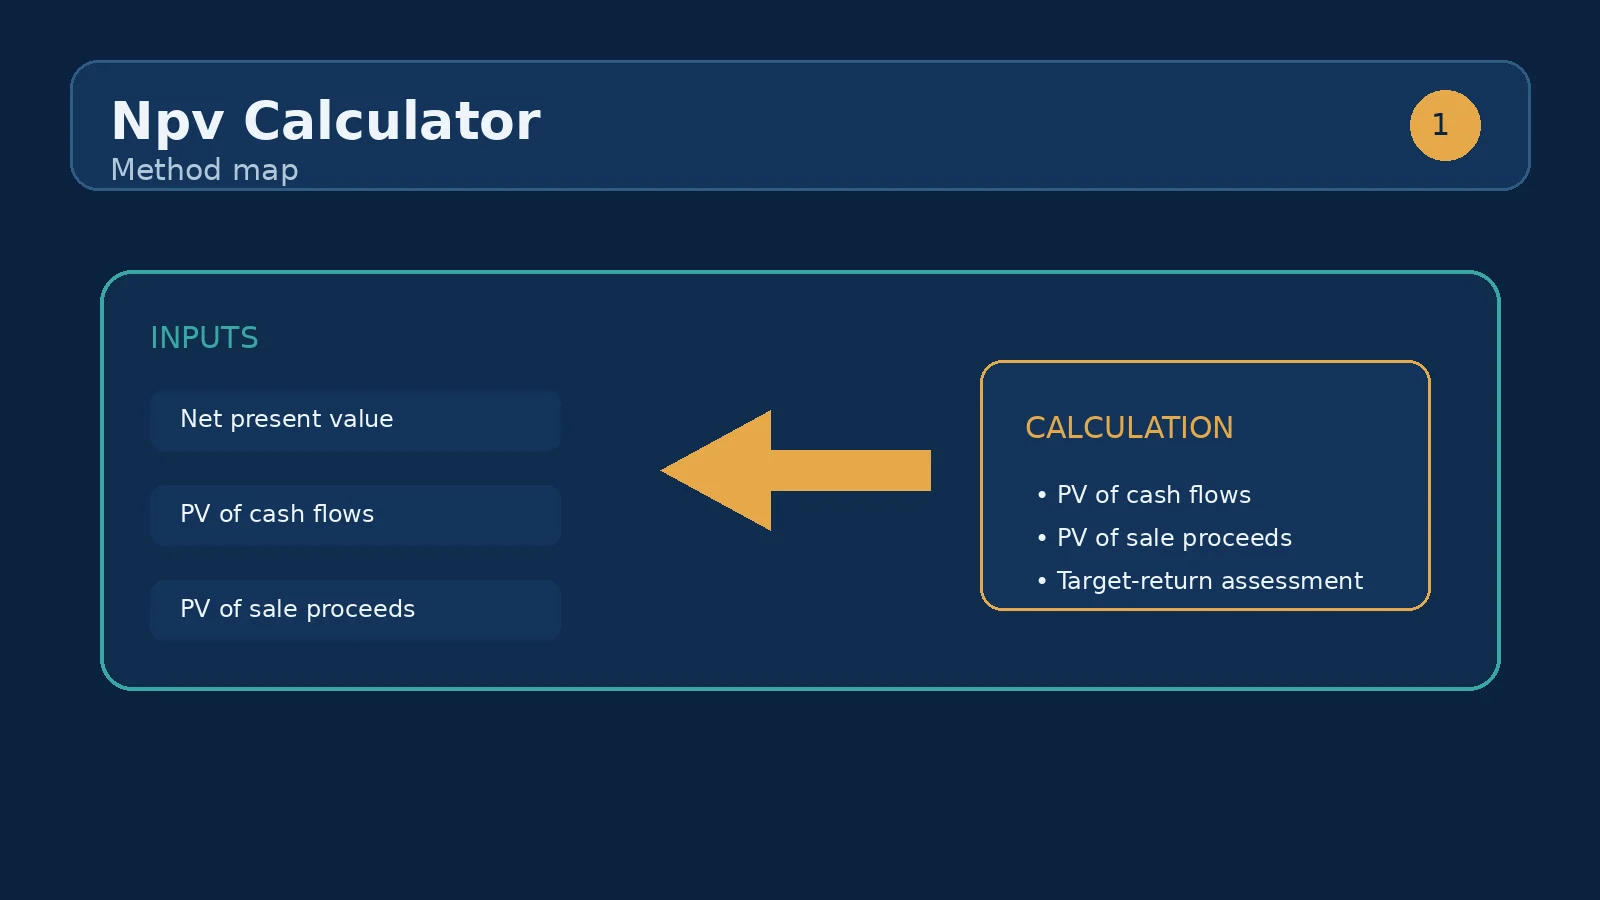
Suppose you enter the component's visible defaults: an initial investment of $100,000, annual net cash flow of $9,000, a 10-year holding period, an 8% discount rate, and estimated net sale proceeds of $150,000. The undiscounted receipts total $240,000, but that total is not the decision metric because the $9,000 payments arrive over ten years and the sale proceeds arrive at the end.
Using those assumptions, the present value of the annual cash flows is approximately $60,391. The exact displayed amount should be taken from the live result rather than copied from a rounded hand calculation; the same caution applies to the sale-proceeds component. What matters for interpretation is the reconciliation: the calculator adds the two displayed present values, subtracts the $100,000 initial investment, and shows the resulting NPV. If the NPV is positive, the modeled receipts clear an 8% return threshold in present-value terms; if negative, they do not.
For a clean scenario comparison, change one input at a time. First lower the exit value while leaving the annual cash flow unchanged. Then restore it and test a higher discount rate. Finally, test a shorter holding period and ask whether the reduced discounting of an earlier exit offsets the lost years of cash flow. This sequence separates operational income, terminal value, and timing rather than blending all three changes into one unexplained result.
Net present value is the central output. A positive number means the modeled investment creates value above the selected discount rate; a value near zero means it is approximately at the threshold; a negative number means the modeled receipts fall short of that hurdle. The assessment text mirrors this interpretation: beats your target return, meets your target return, or falls short of your target return. The wording is comparative, not predictive. It says how the entered scenario compares with the entered target.
PV of cash flows isolates the discounted recurring income. PV of sale proceeds isolates the discounted terminal release. Compare their sizes before deciding whether the NPV is resilient. A project with modest recurring value and a very large exit component may be more sensitive to sale timing or exit assumptions than its headline NPV suggests. Conversely, a project whose present value is mostly recurring cash flow may be less dependent on one terminal estimate, though it still depends on the annual amount being credible.
Simple profit adds receipts and subtracts the initial investment without adjusting for timing. In the worked scenario, that arithmetic would be $240,000 minus $100,000, or $140,000 before considering the date of each receipt. NPV asks a stricter question: after discounting the annual cash flows and the final sale proceeds at 8%, is the value received today greater than $100,000? The two measures answer different questions and should not be substituted for one another.
Payback period is another useful but separate comparison. Payback asks when cumulative undiscounted receipts recover the initial amount; it does not necessarily reward cash received earlier after recovery and does not incorporate the discount rate. NPV, by contrast, uses every modeled receipt and expresses the result in one present-value figure. A sibling return metric can help, but its assumptions should be kept visible rather than blended into the NPV input fields.
The first mistake is entering gross revenue as annual net cash flow. The field is explicitly annual net cash flow, so recurring costs that your forecast requires should be reflected before entry, using the same basis for every year. The second is entering a gross sale price as estimated net sale proceeds. The component's hint points to the amount of equity released at sale; an amount that ignores deductions can overstate the terminal contribution.
A third mistake is choosing a discount rate merely because it makes the answer positive. The rate is the target return used for comparison, so changing it changes the question. A fourth is treating the holding period as a formatting detail. It determines both how many annual cash flows are discounted and when the exit value is received. Finally, avoid false precision: a result rounded to the nearest dollar cannot make uncertain forecasts precise. Use the calculator to expose sensitivity, not to disguise it.
Start with a base case that uses one internally consistent forecast. Record the NPV, PV of cash flows, PV of sale proceeds, and assessment. Next create an operating case by changing only annual net cash flow. Then create a market or timing case by changing only estimated net sale proceeds or the holding period. The final case can change only the discount rate. Comparing these outputs shows whether the decision is driven by recurring performance, terminal value, timing, or the return threshold.
When a project is being compared with another opportunity, align the holding-period convention and discount-rate convention first. A ten-year scenario with a sale at year ten is not directly comparable to a five-year scenario unless the underlying return hurdle and cash-flow definitions are understood. Keep the initial investment, annual flow, and exit proceeds in the same currency and measurement basis, and document what each amount includes.
Use the NPV result as a screening signal, then move to a sibling tool that answers the next question. If you need to understand the annual recovery path, an investment or cash-flow calculator can help isolate recurring receipts. If you want to test the effect of changing the exit assumption, rerun this calculator with a range of sale proceeds and holding periods. If the next question is how quickly the initial outlay is recovered, use a payback-oriented calculator where available, while remembering that payback does not replace discounting.
The most useful handoff is disciplined: carry forward the same initial investment and cash-flow definition, state whether the sale figure is net, and note the discount rate used. Then compare the new output with the NPV assessment instead of treating either tool as a standalone approval. The component gives you a transparent bridge from five assumptions to one value judgment, and the next tool should deepen that bridge rather than introduce an unexplained metric.
Use the minimum annual return you would accept for taking this risk. Many investors use their cost of capital or the return available from a comparable alternative.
The investment is projected to earn more than your discount rate. A negative NPV means it falls short of that benchmark.
It means the discounted annual net cash flows and discounted sale proceeds exceed the initial investment at the entered discount rate.
No. The component describes it as net sale proceeds or equity released when you sell, so enter the amount remaining after deductions represented by your forecast.
Because the calculator discounts the exit value back from the end of the holding period; a later receipt contributes less than the same receipt today.
The field has no nonnegative minimum in the component, so a negative modeled annual flow may be entered if it reflects the forecast convention you are using.
It compares the calculated NPV with the target return represented by your discount rate and reports whether the scenario beats, meets, or falls short of that target.
Only when you are deliberately searching for a break-even return; otherwise choose the rate that represents your intended hurdle and test sensitivity around it.
Using NPV for property investment: how to discount cash flows, choose a rate, and interpret the result with worked examples.
How we calculate: calcNpv in calculators.ts; regression checks in calculators.test.ts
Last reviewed: . Learn more about Nirmal Lashkari and LashkariProperties.
Disclaimer: This calculator provides estimates for informational purposes only and is not financial, tax, or legal advice. Verify figures with a qualified professional before making decisions.
