 By Nirmal Lashkari · Founder · Indore, Madhya Pradesh, India
$20,000 invested initially, $500 added monthly, an 8% annual return, and a 15-year horizon, the projected future value is $239,157.54, comprising $110,000.00 in contributions and $129,157.54 in growth. These figures use monthly compounding and end-of-month contributions.
Future value: $239,157.54

This calculator estimates the future value of a recurring investment plan from four visible inputs: an initial amount, a monthly contribution, an annual return percentage, and a time horizon in years. It then reports three outputs: future value, total contributions, and total growth. The result is a planning estimate of how a starting balance and repeated deposits could accumulate when the stated return is applied consistently. It is not a record of a particular account, fund, or market outcome.
The most useful distinction is between money you put in and value attributed to growth. Total contributions include the initial amount plus every monthly contribution across the selected horizon. Total growth is the difference between future value and total contributions. Reading those three lines together prevents a common mistake: treating the entire future value as investment profit.
The displayed dollar prefix and currency formatting make the figures easy to scan, while the percentage and years suffixes keep the units visible. Because the component accepts numeric fields with nonnegative amounts and a minimum one-year horizon, enter assumptions rather than text descriptions. Change one assumption at a time when comparing plans so the reason for any difference remains clear.
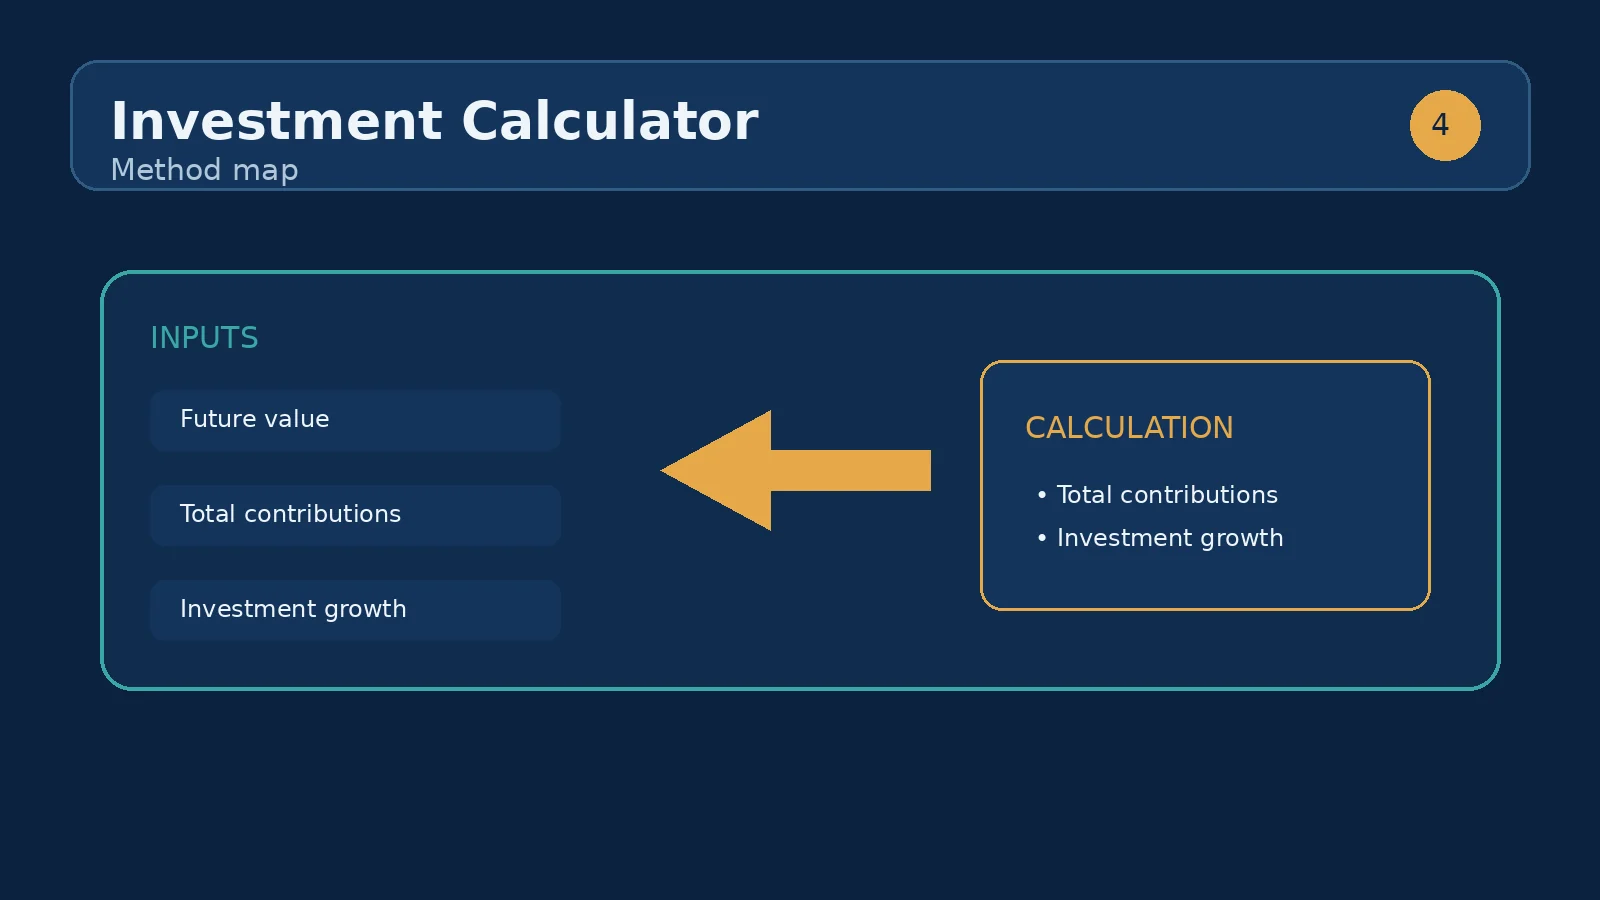
Initial amount is the balance available at the beginning of the projection. It receives the longest opportunity to compound, so an early dollar can influence the result for the entire time horizon. Monthly contribution is the repeated deposit entered as a dollar amount. In the model, that amount is applied twelve times per year across the selected number of years, which means it represents a regular contribution pattern rather than an occasional lump sum.
Annual return is entered as a percentage, and the field accepts decimal percentage steps such as 7.5 or 8.1. A higher assumption increases the modeled growth, but it also makes the projection more sensitive to the difference between an assumed average and the returns actually experienced. Time horizon is entered in years and must be at least one. Extending the horizon adds both more deposits and more periods during which earlier balances can grow.
These inputs are not interchangeable. Increasing the initial amount changes the starting base. Increasing the monthly contribution changes the cash-flow schedule. Increasing the annual return changes the growth assumption. Increasing years changes the length of both schedules. A useful review note should record all four values, because a future-value figure without its assumptions is difficult to reproduce or evaluate.
For a typical monthly-compounding projection, the initial amount is grown across the full number of monthly periods, while each monthly contribution is grown for the remaining periods after it is deposited. The annual percentage is converted to a periodic rate, and the number of periods is twelve times the years input. This structure explains why the calculator can show total contributions separately from total growth: contributions are counted directly, while growth is the modeled accumulation above those deposits.
A simplified expression for the ending value is the future value of the initial balance plus the future value of an annuity of monthly deposits. If the periodic rate is zero, the result reduces to the initial amount plus all scheduled monthly contributions. That zero-return check is especially helpful for testing whether an apparent gain comes from deposits or from the return assumption.
The component itself displays the computed future value, total contributions, and total growth through a result list. It does not expose a year-by-year balance table, fees field, tax field, inflation adjustment, volatility measure, or withdrawal schedule. Do not infer those features from the headline result; use this page for a focused accumulation estimate.
Consider the component's starting values: an initial amount of $20,000, a monthly contribution of $500, an annual return assumption of 8%, and a 15-year time horizon. The scheduled deposits total $90,000 over 180 months, and adding the initial amount produces total contributions of $110,000. The future value is approximately $278,000 under a conventional monthly-compounding interpretation of the 8% annual assumption, leaving roughly $168,000 as modeled total growth.
The exact displayed amount should be treated as the calculator's output after its implementation applies the annual-rate convention and contribution timing. The important reading is structural: less than half of the ending value comes from the initial amount alone, while the recurring deposits build a substantial base and the return assumption accounts for the remainder. If the annual return is changed to zero while keeping the other inputs fixed, the future value should align with the $110,000 contribution total.
A practical way to use this scenario is to save a snapshot before changing it. Then test a lower return, a higher monthly contribution, and a shorter horizon separately. If the plan only looks workable under a high return and a long horizon, the result is assumption-dependent; if it remains useful under more conservative settings, the contribution habit is doing more of the work.
Start with a contribution comparison. With the same $20,000 initial amount, 8% annual return, and 15 years, changing the monthly contribution from $500 to $750 adds $45,000 of deposits over the horizon before any associated growth is considered. The future value should rise by more than the raw deposit difference when those additional deposits also receive time to grow, although later deposits have less time than earlier ones.
Next compare the return assumption without changing cash flow. Moving from 8% to 6% does not alter total contributions at all; it alters the modeled growth and therefore the future value. This is a useful diagnostic because it shows whether a change in the result came from saving more or from expecting more growth. A return comparison should be presented as a range of assumptions, not as a promise that one percentage will occur.
Finally compare time horizons. Extending 15 years to 20 years adds $30,000 of $500 monthly deposits, but the earlier balance also receives five additional years of modeled growth. That combination is why time can have a disproportionate effect on the ending figure. Conversely, shortening the horizon can reduce the result even when the initial amount and monthly contribution remain unchanged.
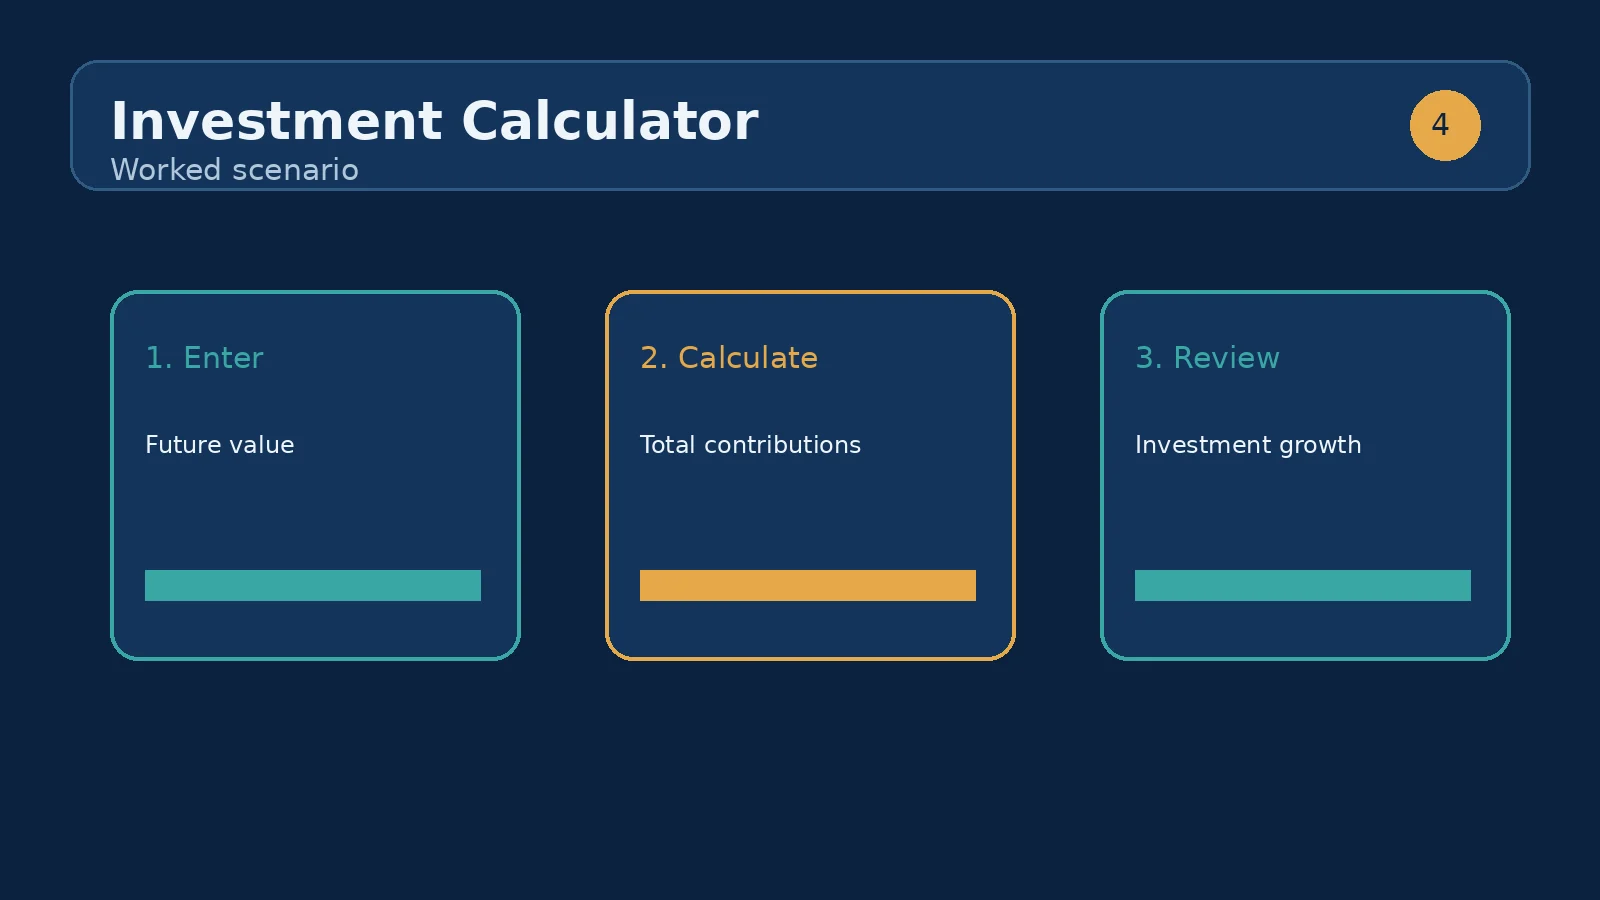
Future value is the projected ending balance after the selected number of years. It combines the starting amount, scheduled monthly deposits, and modeled growth. It is the headline output for a long-term accumulation question, but it should always be read beside the assumptions and the contribution total.
Total contributions is the amount supplied by the investor in the model. It includes the initial amount and the monthly contribution multiplied across the horizon. This line answers, “How much cash did the plan put in?” It does not include gains and does not represent a required deposit outside the entered schedule.
Total growth is future value minus total contributions. It answers, “How much of the projected ending balance is above the modeled deposits?” A positive value reflects the selected positive return assumption. If the annual return is zero, growth should be zero. The component constrains the visible annual return to zero or above, so this page does not model a negative-return scenario through its standard field settings.
The first mistake is entering an annual percentage as a whole-number multiplier. Enter 8 for 8%, not 0.08%, and do not enter 800. The second is confusing the initial amount with the monthly contribution. A starting balance is invested once at the beginning; the monthly amount is repeated across the horizon. Swapping them can produce a plausible-looking but materially different result.
Another mistake is reading total growth as guaranteed profit. The calculator applies an assumption to project an outcome; it does not know future market performance, contribution interruptions, fees, taxes, inflation, or the path of returns. A steady modeled rate can therefore look smoother than real account values. Use the output for comparison and planning, then add outside analysis for costs, purchasing power, and risk.
Do not double-count deposits by adding the monthly contribution to future value after the calculator has already included it. Do not describe the result as a withdrawal amount, a retirement income, or an account balance after fees because those outputs are not implemented here. Finally, avoid comparing two results when several inputs changed at once; isolate the variable you want to understand.
For a disciplined review, enter the amount already available, the monthly amount that can actually be maintained, a clearly labeled annual-return assumption, and the intended number of years. Record the three outputs. Repeat the calculation with a lower return assumption and with a contribution amount that reflects a tighter month. Compare future value and total growth, but also compare total contributions so the source of the difference stays visible.
The next sibling-tool use case is an amortization or loan calculator when the same cash flow must be compared with debt reduction rather than investment accumulation. For example, a person deciding between investing an extra $500 each month and paying additional principal can use this calculator to model the investment side, then use an extra-payment or loan calculator to model the debt side. The two tools answer different questions, so compare their assumptions and outputs rather than merging them into one unsupported figure.
Keep the final interpretation modest: the calculator shows what the entered schedule would produce under the entered annual return convention. Its strongest use is side-by-side planning—testing whether changing deposits or time makes a meaningful difference—while remembering that actual results can differ from a smooth projection.
No. This is a projection based on a constant assumed return. Actual investment returns vary and can be negative.
The projection compounds the starting amount monthly at the annual rate divided by 12, with each contribution added at the end of its month. On the defaults — $20,000 initial, $500 a month, 8% a year for 15 years — the projected value is $239,157.54.
Contributions are the starting amount plus every monthly deposit: $20,000 plus $500 × 180 months is $110,000 on the defaults. The remaining $129,157.54 of the projected value is growth.
Be conservative. The model applies one constant rate for the whole horizon, while real returns swing year to year. Test a lower rate to see how sensitive the outcome is before relying on the headline figure.
Yes. This calculator adds contributions at the end of each month, which is slightly more conservative than assuming they are invested at the start of the month.
It includes the initial amount plus every monthly contribution scheduled across the entered number of years.
No. Total growth is the modeled difference between future value and contributions under the entered annual return assumption.
The projection should reduce to the initial amount plus the scheduled monthly contributions, with no modeled growth.
A longer horizon adds more monthly deposits and gives earlier balances more periods in which the assumed return can compound.
The visible field sets a minimum of zero, so the standard component does not provide a negative-return input.
No. The visible inputs and outputs cover amount, monthly contribution, annual return, years, future value, contributions, and growth; fees, taxes, and inflation are not separate fields.
No. It is an ending accumulation estimate, not a withdrawal schedule or income calculation.
How to estimate property appreciation realistically: historical data, growth drivers and why past returns rarely repeat.
How we calculate: calcInvestment in calculators.ts; regression checks in calculators.test.ts
Last reviewed: . Learn more about Nirmal Lashkari and LashkariProperties.
Disclaimer: This calculator provides estimates for informational purposes only and is not financial, tax, or legal advice. Verify figures with a qualified professional before making decisions.
