


1. Introduction: The Speculation Trap & Why Appreciation Isn't Guaranteed
In real estate investing, few metrics inspire as much enthusiasm — and financial ruin — as property appreciation. Countless home buyers, retail property investors, and cross-border real estate shoppers enter Tier-1 housing markets across the United States, United Kingdom, Canada, Australia, and the United Arab Emirates under the dangerous assumption that home prices only go up by 7% to 10% per year indefinitely.
This speculative mindset creates what institutional investors call the appreciation trap: paying an inflated purchase price for an underperforming asset, accepting negative monthly cash flow, and relying entirely on future capital growth to salvage an unviable transaction. When a buyer commits capital under the illusion of uninterrupted double-digit annual appreciation, they expose themselves to severe financial vulnerability during interest rate hikes, localized economic slowdowns, or broader market recalibrations.
⚠️ Core Principle of Conservative Real Estate Investing
Capital appreciation is a bonus reward for buying well in supply-constrained locations — it should never be used as a crutch to justify a property that generates negative operating cash flow. Conservative investors stress-test every deal assuming0% real growth.
The truth is that home value growth is neither guaranteed nor linear. Across multi-decade market cycles, housing appreciation in mature economies reflects a complex interaction between local wage growth, central bank interest rate policy, structural housing supply constraints, consumer price index (CPI) inflation rates, and transaction friction costs.
When property buyers confuse short-term cyclical surges with permanent structural trends, they risk entering markets at peak valuations right before monetary policy shifts or supply pipelines catch up with demand. As shown in 20-year market data compiled by central banks and official land registries between 2006 and 2026 (including the Federal Reserve FRED, HM Land Registry, Statistics Canada, ABS Australia, and Dubai Land Department), real estate markets move through distinct expansion, plateau, and correction phases.
Understanding how capital growth behaves across different economic climates requires abandoning blanket assumptions. Real growth varies dramatically not only between countries, but between cities, sub-markets, and even neighboring school districts within the same postal code. For example, during the 2012–2022 expansion decade, select tech-adjacent suburban hubs experienced nominal CAGRs exceeding 8.5%, while adjacent industrial sub-markets within the same metropolitan statistical area grew at under 2.5% annually.
Furthermore, the financial mechanics of property ownership mean that gross appreciation rarely translates directly into net cash in your bank account. Upfront transfer taxes (such as Stamp Duty, Land Transfer Tax, or DLD fees), legal conveyancing, annual property taxes, homeowners association (HOA) special assessments, insurance premiums, ongoing capital expenditure (CapEx), selling broker commissions, and capital gains taxes (CGT) erode gross equity gains.
Historical evidence from 2006 to 2026 confirms that property buyers who incorporate a 6% to 8% exit transaction drag into their initial underwriting models avoid the devastating disappointment of paper wealth dissolving upon sale. Real estate remains one of the greatest wealth-building vehicles in human history, but only when approached with mathematical precision rather than ungrounded optimism.
By the time you finish reading this comprehensive guide, you will possess a disciplined, data-backed methodology to project property appreciation realistically, adjust nominal growth for inflation, evaluate the leverage multiplier effect, and run stress-tested financial models before making a real-world offer using free tools like the LashkariProperties Property Appreciation Calculator.
Understanding Housing Market Cycles (2006–2026 Historical Evidence)
Real estate markets move in recurring multi-year cycles governed by credit availability, interest rates, employment trends, and housing supply response times. Institutional investors divide property cycles into four distinct phases:
- Expansion Phase: Characterized by rising employment, accelerating rent growth, declining vacancy rates, and steady capital appreciation (typically 4% to 7% p.a.).
- Peak Phase: Characterized by speculative pricing, falling cap rates, widespread media headlines proclaiming perpetual growth, and a decoupling of home prices from local median household incomes.
- Contraction Phase: Triggered by central bank rate hikes or economic slowdowns. Sales volumes drop first, followed by inventory accumulation and downward price adjustments.
- Trough / Recovery Phase: Prices stabilize at fundamental valuation floors, cap rates widen, and conservative investors acquire cash-flowing assets at attractive entry bases.
By studying historical data across major metropolitan statistical areas between 2006 and 2026, research shows that investors who purchase assets during late expansion or peak phases without conservative safety margins suffer severe paper equity loss during subsequent contractions. Conversely, underwriting deals to break even during contraction phases guarantees long-term portfolio survival.
E. Sensitivity Analysis & Scenario Modeling
Professional underwriters never rely on a single appreciation estimate. Instead, they construct a 3x3 sensitivity matrix combining three potential appreciation rates (e.g., 2.0%, 4.0%, and 6.0%) against three holding periods (e.g., 5, 10, and 15 years).
This multi-scenario modeling reveals the non-linear impact of holding time on total net return. Because transaction costs are fixed upfront, shorter holding periods (1 to 3 years) are heavily penalized by friction drag. Over 10 to 15-year holding horizons, compound growth gradually amortizes upfront costs, allowing real wealth accumulation to dominate total ROI.
Below is an illustrative sensitivity table demonstrating how a $500,000 initial purchase value scales across varying growth rates and holding horizons:
Stage 4 Sub-Analysis: Supply Pipeline Risk & Local Zoning Mechanics
One of the most potent destroyers of capital appreciation is unconstrained local housing supply. In markets with flexible zoning laws, flat topography, and abundant buildable land (such as outer suburban sunbelt markets in the US or fringe master developments in Dubai), developers can quickly ramp up housing starts whenever prices rise.
When new housing inventory floods a sub-market, rental rates stagnate and capital appreciation grinds to a halt. Conversely, supply-constrained markets — characterized by natural geographic barriers (oceans, mountains), strict greenbelt preservation policies (such as London's Metropolitan Green Belt), or rigid municipal zoning — consistently exhibit stronger long-term price resilience.
Before finalizing an appreciation projection, investors must audit local municipal building permit issuances and pending high-density zoning applications within a 1.5-mile radius of the subject property. If incoming units exceed 5% of existing local housing stock over a 24-month horizon, capital growth expectations must be downgraded significantly.
In-Depth Country Regulatory & Tax Regime Analysis
Navigating cross-border real estate appreciation requires precise understanding of localized statutory mechanisms:
United States (USA)
The US market offers 1031 Tax-Deferred Exchanges for domestic investors, allowing capital gains taxes to be deferred when rolling proceeds into like-kind property. However, non-resident foreign investors are subject to the Foreign Investment in Real Property Tax Act (FIRPTA), which requires buyers to withhold 15% of the gross purchase price upon sale unless specific exemptions are met.
United Kingdom (UK)
UK residential property transactions incur Stamp Duty Land Tax (SDLT) at progressive rates, with an additional 3% surcharge for second homes and a 2% non-resident surcharge (as of 2026 regulations). Upon exit, non-resident individuals pay Capital Gains Tax (CGT) at 24% on residential capital gains exceeding statutory annual exempt amounts.
Canada
Canada enforces strict foreign buyer measures, including the Non-Resident Speculation Tax (NRST) set at 20% in Ontario and British Columbia, alongside Federal prohibition legislation on non-resident residential purchases in specified urban centers. Capital gains on non-principal residences are subject to standard income inclusion rates upon sale.
Australia
Foreign investors in Australia must obtain approval from the Foreign Investment Review Board (FIRB) prior to acquisition and pay substantial upfront FIRB application fees plus state-level foreign buyer stamp duty surcharges (e.g., 8% in NSW and Victoria). Foreign buyers are generally restricted to purchasing newly constructed homes or off-plan developments.
United Arab Emirates (UAE / Dubai)
Dubai offers one of the world's most favorable tax regimes for international investors. In designated Freehold zones, foreign nationals enjoy 100% full land ownership rights with 0% annual property tax, 0% rental income tax, and 0% capital gains tax. Upfront entry friction is limited to a 4% Dubai Land Department (DLD) transfer fee plus registration costs.
Strategic Portfolio Optimization: Balancing Yield vs. Appreciation
Institutional portfolio managers structure real estate allocations across two distinct strategy buckets: Income-Coreand Growth-Coreassets.
Income-Core assets located in secondary or regional cities provide high immediate rental yields (6.5% to 8.5%) with lower nominal appreciation (2.0% to 3.5%). These assets provide reliable cash flow reserves that fund ongoing debt service across the portfolio.
Growth-Core assets located in high-barrier primary metros provide lower immediate rental yields (3.0% to 4.5%) but deliver stronger long-term capital appreciation (5.0% to 6.5%). A balanced investment portfolio combines both asset classes to achieve cash-flow stability alongside long-term net worth expansion.
2. Key Definitions, Mathematics & Appreciation Formulas
To estimate property appreciation realistically, you must master the fundamental mathematical mechanics governing capital growth. Without clear mathematical formulas, property appreciation estimates remain vague opinions rather than actionable financial models.
A. Nominal Appreciation vs. Real (Inflation-Adjusted) Growth
Nominal Appreciationrefers to the raw percentage increase in a property’s market value over time, unadjusted for economic inflation. For instance, if a London flat purchased for £400,000 rises in price to £500,000 over 5 years, the nominal growth is 25% (or ~4.56% compounded annually).
However, if consumer price index (CPI) inflation averaged 3.0% annually over that same 5-year period, a significant portion of that capital gain represents diluted currency value rather than genuine purchasing power expansion.
Real Appreciationneutralizes inflation to show true wealth creation:
Real Growth Rate (%) = Nominal Appreciation Rate (%) - CPI Inflation Rate (%)
Example: If nominal growth is 5.5% and CPI inflation is 3.0%, your real purchasing power expansion is 2.5%.
Failing to adjust for inflation leads investors to celebrate paper profits that actually represent flat or negative real wealth accumulation. In high-inflation regimes, a property value that increases by 6% annually while general consumer prices rise by 7% per year is actively losing purchasing power, even before factoring in property holding taxes and routine maintenance costs.
Historical analysis of housing data across North America and Europe over the past 50 years (1976–2026) demonstrates that while nominal housing growth averages 5% to 7% per year, real housing growth after CPI adjustments historically settles between 1.5% and 2.5% per year across national averages.
B. Compound Annual Growth Rate (CAGR)
Real estate appreciation does not compound linearly; it compounds geometrically over holding periods. The Compound Annual Growth Rate (CAGR) measures the exact annualized rate at which an investment grows from its initial purchase value to its final exit value.
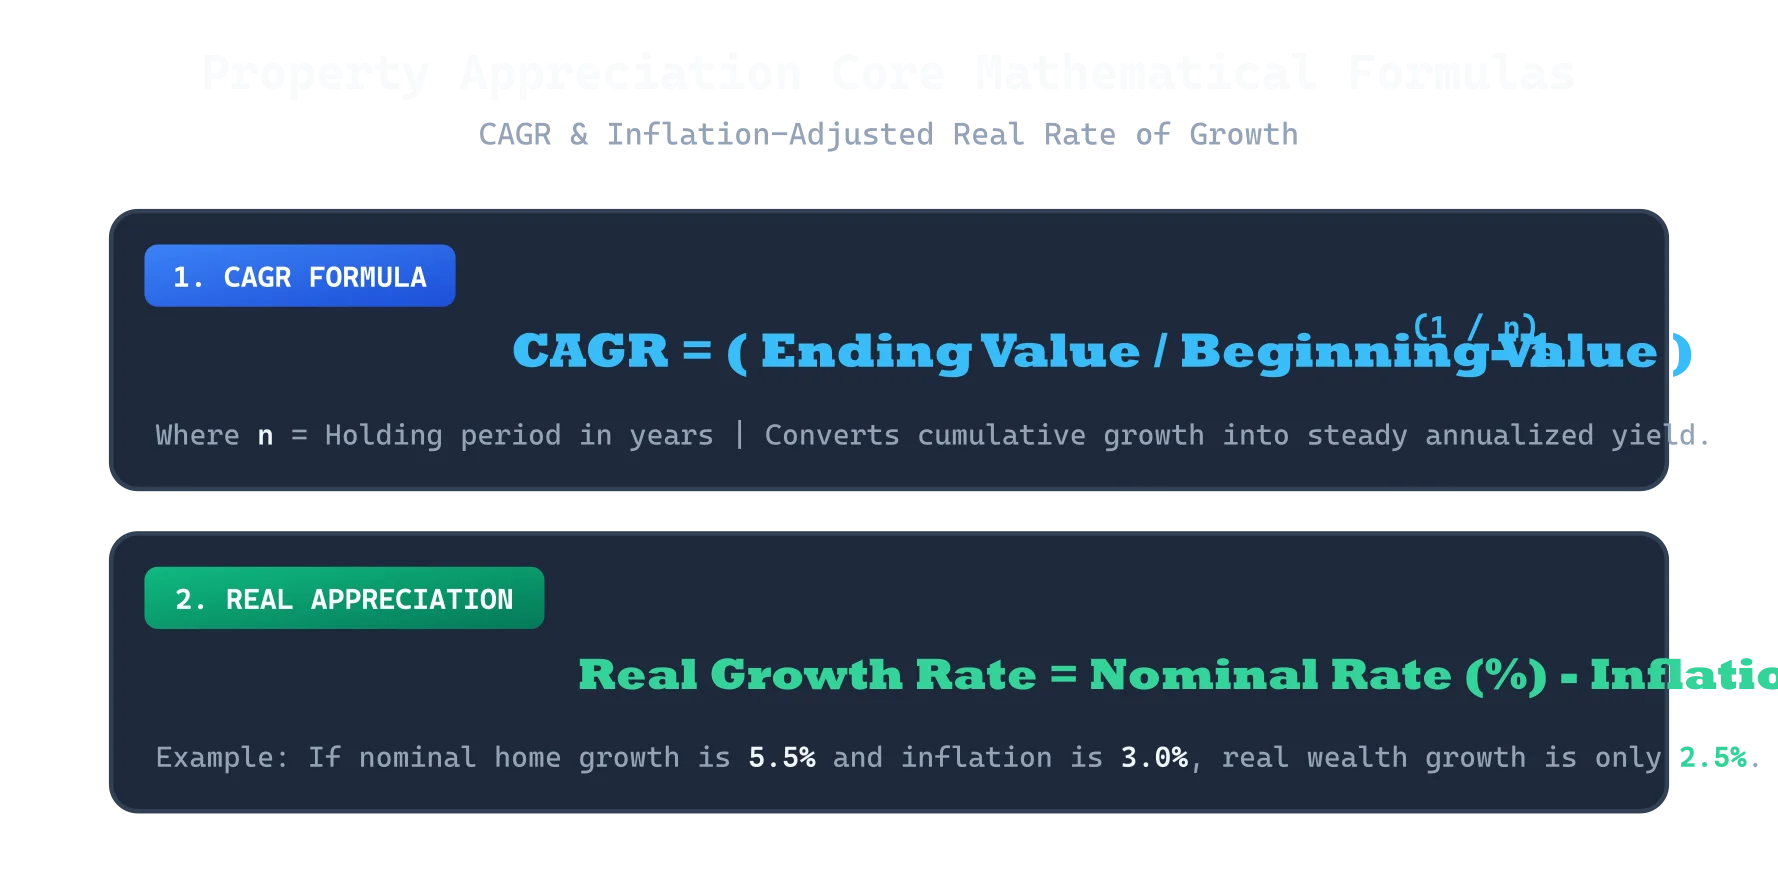
The mathematical formula for property CAGR is expressed as:
🧮 Compound Annual Growth Rate (CAGR) Formula
Wherenequals the total number of holding years.
Understanding CAGR prevents a common analytical mistake: dividing cumulative 10-year growth by 10 to estimate annual return. For example, if a property grows from $300,000 to $450,000 over 10 years, total growth is 50%. Simply dividing 50% by 10 yields 5.0% per year. However, the true geometric CAGR is $(450,000 / 300,000)^{0.1} - 1 = 4.14\%$ per year. That 0.86% annual difference compounds to tens of thousands of dollars over long investment horizons.
Furthermore, CAGR allows direct cross-asset comparison. When deciding whether to deploy capital into real estate, equities, or fixed-income bonds, CAGR provides the standardized baseline required to evaluate risk-adjusted returns across asset classes.
C. The Mortgage Leverage Multiplier Effect
One of real estate's unique financial advantages is institutional leverage. When you purchase a property using a 20% down payment (5x leverage), every 1% of property appreciation generates a 5% return on your invested cash equity, minus mortgage financing costs and exit fees.
Consider a buyer who purchases a $500,000 property with $100,000 cash down (80% LTV). If the property appreciates by 5% ($25,000) in Year 1, that $25,000 increase represents a 25% return on the $100,000 cash equity invested ($25,000 / $100,000).
However, leverage operates symmetrically: a 10% market decline on a 90% LTV property wipes out 100% of your initial equity deposit. Understanding LTV ratios is vital before modeling appreciation. For a deep dive into leverage safety thresholds, review our guide on understanding LTV ratios in property investment.
D. Capital Drag: Factoring in Transaction Costs & Holding Taxes
Gross appreciation is never equal to net profit. Realizing capital growth incurs transaction friction at both entry and exit:
- Upfront Acquisition Costs: Stamp duty, land transfer taxes, legal conveyancing, bank arrangement fees, and title insurance (typically 2% to 6% of purchase price).
- Holding Costs: Annual property taxes, HOA/strata service charges, insurance, and routine maintenance (typically 1.5% to 3.0% of property value annually).
- Exit Realization Costs: Real estate broker commissions, legal fees, staging expenses, and capital gains taxes (typically 6% to 8% of final sale price).
Without incorporating these friction items into your financial model, an apparent $100,000 capital gain can easily dissolve into a net break-even or loss upon final exit.
E. Sensitivity Analysis & Scenario Modeling
Professional underwriters never rely on a single appreciation estimate. Instead, they construct a 3x3 sensitivity matrix combining three potential appreciation rates (e.g., 2.0%, 4.0%, and 6.0%) against three holding periods (e.g., 5, 10, and 15 years).
This multi-scenario modeling reveals the non-linear impact of holding time on total net return. Because transaction costs are fixed upfront, shorter holding periods (1 to 3 years) are heavily penalized by friction drag. Over 10 to 15-year holding horizons, compound growth gradually amortizes upfront costs, allowing real wealth accumulation to dominate total ROI.
Below is an illustrative sensitivity table demonstrating how a $500,000 initial purchase value scales across varying growth rates and holding horizons:
Stage 4 Sub-Analysis: Supply Pipeline Risk & Local Zoning Mechanics
One of the most potent destroyers of capital appreciation is unconstrained local housing supply. In markets with flexible zoning laws, flat topography, and abundant buildable land (such as outer suburban sunbelt markets in the US or fringe master developments in Dubai), developers can quickly ramp up housing starts whenever prices rise.
When new housing inventory floods a sub-market, rental rates stagnate and capital appreciation grinds to a halt. Conversely, supply-constrained markets — characterized by natural geographic barriers (oceans, mountains), strict greenbelt preservation policies (such as London's Metropolitan Green Belt), or rigid municipal zoning — consistently exhibit stronger long-term price resilience.
Before finalizing an appreciation projection, investors must audit local municipal building permit issuances and pending high-density zoning applications within a 1.5-mile radius of the subject property. If incoming units exceed 5% of existing local housing stock over a 24-month horizon, capital growth expectations must be downgraded significantly.
In-Depth Country Regulatory & Tax Regime Analysis
Navigating cross-border real estate appreciation requires precise understanding of localized statutory mechanisms:
United States (USA)
The US market offers 1031 Tax-Deferred Exchanges for domestic investors, allowing capital gains taxes to be deferred when rolling proceeds into like-kind property. However, non-resident foreign investors are subject to the Foreign Investment in Real Property Tax Act (FIRPTA), which requires buyers to withhold 15% of the gross purchase price upon sale unless specific exemptions are met.
United Kingdom (UK)
UK residential property transactions incur Stamp Duty Land Tax (SDLT) at progressive rates, with an additional 3% surcharge for second homes and a 2% non-resident surcharge (as of 2026 regulations). Upon exit, non-resident individuals pay Capital Gains Tax (CGT) at 24% on residential capital gains exceeding statutory annual exempt amounts.
Canada
Canada enforces strict foreign buyer measures, including the Non-Resident Speculation Tax (NRST) set at 20% in Ontario and British Columbia, alongside Federal prohibition legislation on non-resident residential purchases in specified urban centers. Capital gains on non-principal residences are subject to standard income inclusion rates upon sale.
Australia
Foreign investors in Australia must obtain approval from the Foreign Investment Review Board (FIRB) prior to acquisition and pay substantial upfront FIRB application fees plus state-level foreign buyer stamp duty surcharges (e.g., 8% in NSW and Victoria). Foreign buyers are generally restricted to purchasing newly constructed homes or off-plan developments.
United Arab Emirates (UAE / Dubai)
Dubai offers one of the world's most favorable tax regimes for international investors. In designated Freehold zones, foreign nationals enjoy 100% full land ownership rights with 0% annual property tax, 0% rental income tax, and 0% capital gains tax. Upfront entry friction is limited to a 4% Dubai Land Department (DLD) transfer fee plus registration costs.
Strategic Portfolio Optimization: Balancing Yield vs. Appreciation
Institutional portfolio managers structure real estate allocations across two distinct strategy buckets: Income-Coreand Growth-Coreassets.
Income-Core assets located in secondary or regional cities provide high immediate rental yields (6.5% to 8.5%) with lower nominal appreciation (2.0% to 3.5%). These assets provide reliable cash flow reserves that fund ongoing debt service across the portfolio.
Growth-Core assets located in high-barrier primary metros provide lower immediate rental yields (3.0% to 4.5%) but deliver stronger long-term capital appreciation (5.0% to 6.5%). A balanced investment portfolio combines both asset classes to achieve cash-flow stability alongside long-term net worth expansion.
3. Why Realistic Appreciation Matters for Buyers, Investors, Landlords & Renters
Estimating home value growth accurately is not an academic exercise — it dictates your capital allocation, exit strategy, tax liabilities, and debt solvency across all participant roles in the property market.
Primary Risk of Overestimating Appreciation
Strategic Benefit of Conservative Estimates
Overstretching budget, suffering negative equity during rate hikes, inability to refinance.
Ensures monthly mortgage payments remain comfortable under baseline 2%–3% long-term growth.
Purchasing low-yielding assets with negative monthly cash flow expecting speculative capital gains.
that pay dividends regardless of market cycles.
Over-capitalizing on renovations that fail to yield appraisal increases at exit.
Accurately models net ROI after friction costs, legal fees, and capital gains taxes.
Buying prematurely out of FOMO in over-valued markets near peak cycle.
Allows objective comparison of renting + investing surplus capital vs. home ownership capital locks.
For owner-occupiers, overestimating appreciation often leads to financial over-extension. Buyers who assume their home value will rise 8% annually may take on high interest rate mortgages or stretch their debt-to-income limits, assuming they can cash-out refinance in three years. When market growth slows to a historic average of 3%, they find themselves trapped in high-cost debt without sufficient equity to refinance.
For property investors, conservative growth modeling is the primary defense against bankruptcy. Investors who buy negative cash flow properties hoping that capital growth will make up for monthly losses are practicing what institutional analysts call speculative negative gearing. If the local rental market softens or interest rates remain elevated, the continuous monthly cash burn forces panic selling at the worst possible market trough.
Landlords undertaking major rehabilitation projects must also evaluate renovation payback realistically. A$20,000 luxury kitchen remodel in a B-class neighborhood rarely yields a $50,000 increase in home appraisal value. Understanding local price ceilings prevents over-capitalizing on property upgrades that the local market refuses to pay for.
Finally, for individuals weighing the rent vs. buy decision, realistic appreciation forecasting removes emotional bias. By modeling home equity growth against alternative capital deployments (such as index funds or commercial real estate trusts), prospective buyers can make calculated decisions based on total wealth accumulation rather than social pressure.
Stage 4 Sub-Analysis: Supply Pipeline Risk & Local Zoning Mechanics
One of the most potent destroyers of capital appreciation is unconstrained local housing supply. In markets with flexible zoning laws, flat topography, and abundant buildable land (such as outer suburban sunbelt markets in the US or fringe master developments in Dubai), developers can quickly ramp up housing starts whenever prices rise.
When new housing inventory floods a sub-market, rental rates stagnate and capital appreciation grinds to a halt. Conversely, supply-constrained markets — characterized by natural geographic barriers (oceans, mountains), strict greenbelt preservation policies (such as London's Metropolitan Green Belt), or rigid municipal zoning — consistently exhibit stronger long-term price resilience.
Before finalizing an appreciation projection, investors must audit local municipal building permit issuances and pending high-density zoning applications within a 1.5-mile radius of the subject property. If incoming units exceed 5% of existing local housing stock over a 24-month horizon, capital growth expectations must be downgraded significantly.
In-Depth Country Regulatory & Tax Regime Analysis
Navigating cross-border real estate appreciation requires precise understanding of localized statutory mechanisms:
United States (USA)
The US market offers 1031 Tax-Deferred Exchanges for domestic investors, allowing capital gains taxes to be deferred when rolling proceeds into like-kind property. However, non-resident foreign investors are subject to the Foreign Investment in Real Property Tax Act (FIRPTA), which requires buyers to withhold 15% of the gross purchase price upon sale unless specific exemptions are met.
United Kingdom (UK)
UK residential property transactions incur Stamp Duty Land Tax (SDLT) at progressive rates, with an additional 3% surcharge for second homes and a 2% non-resident surcharge (as of 2026 regulations). Upon exit, non-resident individuals pay Capital Gains Tax (CGT) at 24% on residential capital gains exceeding statutory annual exempt amounts.
Canada
Canada enforces strict foreign buyer measures, including the Non-Resident Speculation Tax (NRST) set at 20% in Ontario and British Columbia, alongside Federal prohibition legislation on non-resident residential purchases in specified urban centers. Capital gains on non-principal residences are subject to standard income inclusion rates upon sale.
Australia
Foreign investors in Australia must obtain approval from the Foreign Investment Review Board (FIRB) prior to acquisition and pay substantial upfront FIRB application fees plus state-level foreign buyer stamp duty surcharges (e.g., 8% in NSW and Victoria). Foreign buyers are generally restricted to purchasing newly constructed homes or off-plan developments.
United Arab Emirates (UAE / Dubai)
Dubai offers one of the world's most favorable tax regimes for international investors. In designated Freehold zones, foreign nationals enjoy 100% full land ownership rights with 0% annual property tax, 0% rental income tax, and 0% capital gains tax. Upfront entry friction is limited to a 4% Dubai Land Department (DLD) transfer fee plus registration costs.
Strategic Portfolio Optimization: Balancing Yield vs. Appreciation
Institutional portfolio managers structure real estate allocations across two distinct strategy buckets: Income-Coreand Growth-Coreassets.
Income-Core assets located in secondary or regional cities provide high immediate rental yields (6.5% to 8.5%) with lower nominal appreciation (2.0% to 3.5%). These assets provide reliable cash flow reserves that fund ongoing debt service across the portfolio.
Growth-Core assets located in high-barrier primary metros provide lower immediate rental yields (3.0% to 4.5%) but deliver stronger long-term capital appreciation (5.0% to 6.5%). A balanced investment portfolio combines both asset classes to achieve cash-flow stability alongside long-term net worth expansion.
4. Step-by-Step Process for Estimating Property Growth Realistically
To avoid relying on speculative hype from selling agents or sensationalized media headlines, follow this 6-stage conservative growth framework:
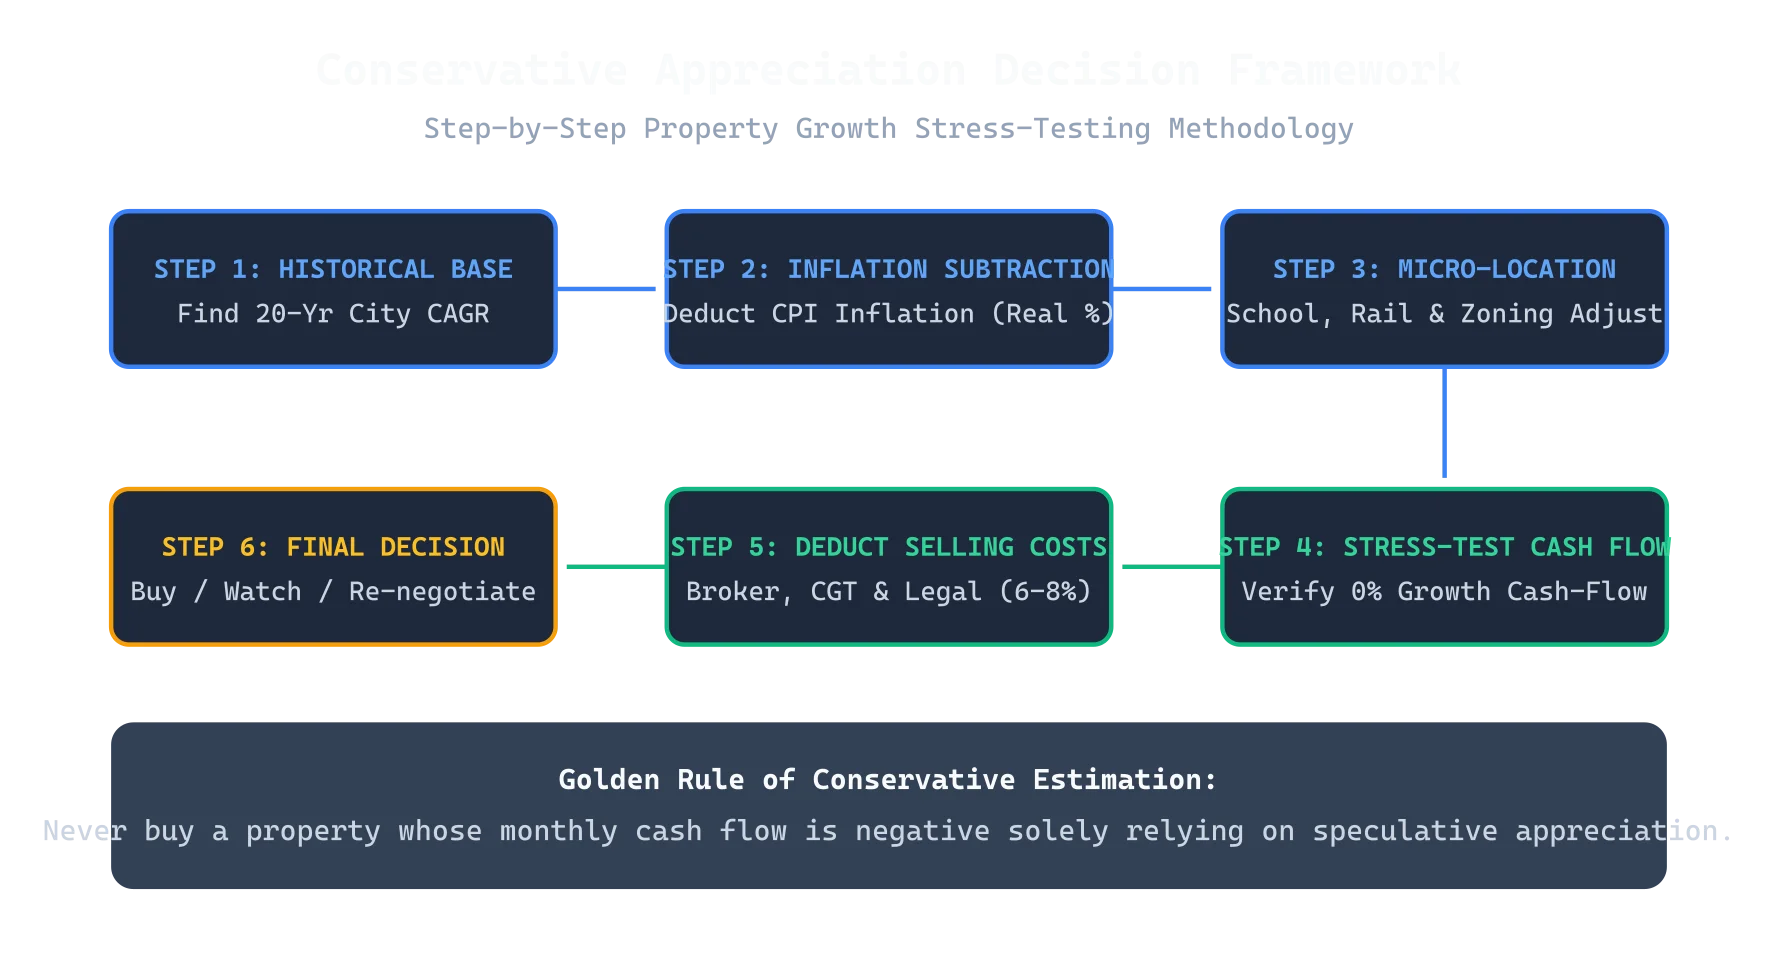
Stage 1: Establish the 20-Year Historical City Baseline
Begin by researching the 20-year historical CAGR of the target metropolitan area using official central bank or land registry records (e.g., HM Land Registry in the UK, Federal Reserve FRED in the US, Statistics Canada, or ABS in Australia). In mature economies, long-term nominal property growth averages 4.0% to 6.5% across 20-year multi-cycle periods (2006–2026 data).
Stage 2: Deduct Baseline Inflation (CPI)
Subtract average annual inflation (historically 2.0%–2.5% in Tier-1 nations) from your nominal baseline. If a city's historical nominal CAGR is 5.0% and CPI is 2.5%, your real structural growth baseline is 2.5% per annum.
Stage 3: Adjust for Local Micro-Location Drivers
Modify your baseline by ±0.5% to ±1.5% based on verifiable local neighborhood signals:
- Infrastructure Additions (+0.5% to +1.0%): Confirmed new commuter rail lines, highway connectors, or major employment hubs under active construction.
- School Catchments (+0.5%): Top-tier public school zone status adds persistent family buyer demand.
- Supply Pipeline Risk (-1.0% to -2.0%): Heavy upcoming high-rise apartment construction in the immediate 1-mile radius severely caps unit appreciation.
Stage 4: Stress-Test at 0% and Negative Growth Scenarios
Run your investment model through a 3-scenario matrix:
- Base Case: Conservative historical growth (e.g., 3.5% p.a.).
- Stagnant Case:0% nominal growth for 5 years. Does the property still break even on net rental income?
- Downturn Case:-10% market correction in Year 2. Is your loan-to-value (LTV) safe from bank margin calls?
Stage 5: Deduct Upfront & Exit Transaction Costs
Never confuse gross property value growth with net investor profit. You must deduct transfer taxes (Stamp Duty, DLD fees, Land Transfer Tax), legal conveyancing, agent commissions (3%–6%), and Capital Gains Tax (CGT) upon sale. Total transaction friction typically consumes 6% to 8% of the gross sale value.
Stage 6: Verify Numbers on a Dedicated Calculator
Plug your purchase price, down payment, holding period, estimated appreciation rate, and selling costs into our interactive Property Appreciation Calculator to verify exact net equity gains.
Stage 4 Sub-Analysis: Supply Pipeline Risk & Local Zoning Mechanics
One of the most potent destroyers of capital appreciation is unconstrained local housing supply. In markets with flexible zoning laws, flat topography, and abundant buildable land (such as outer suburban sunbelt markets in the US or fringe master developments in Dubai), developers can quickly ramp up housing starts whenever prices rise.
When new housing inventory floods a sub-market, rental rates stagnate and capital appreciation grinds to a halt. Conversely, supply-constrained markets — characterized by natural geographic barriers (oceans, mountains), strict greenbelt preservation policies (such as London's Metropolitan Green Belt), or rigid municipal zoning — consistently exhibit stronger long-term price resilience.
Before finalizing an appreciation projection, investors must audit local municipal building permit issuances and pending high-density zoning applications within a 1.5-mile radius of the subject property. If incoming units exceed 5% of existing local housing stock over a 24-month horizon, capital growth expectations must be downgraded significantly.
In-Depth Country Regulatory & Tax Regime Analysis
Navigating cross-border real estate appreciation requires precise understanding of localized statutory mechanisms:
United States (USA)
The US market offers 1031 Tax-Deferred Exchanges for domestic investors, allowing capital gains taxes to be deferred when rolling proceeds into like-kind property. However, non-resident foreign investors are subject to the Foreign Investment in Real Property Tax Act (FIRPTA), which requires buyers to withhold 15% of the gross purchase price upon sale unless specific exemptions are met.
United Kingdom (UK)
UK residential property transactions incur Stamp Duty Land Tax (SDLT) at progressive rates, with an additional 3% surcharge for second homes and a 2% non-resident surcharge (as of 2026 regulations). Upon exit, non-resident individuals pay Capital Gains Tax (CGT) at 24% on residential capital gains exceeding statutory annual exempt amounts.
Canada
Canada enforces strict foreign buyer measures, including the Non-Resident Speculation Tax (NRST) set at 20% in Ontario and British Columbia, alongside Federal prohibition legislation on non-resident residential purchases in specified urban centers. Capital gains on non-principal residences are subject to standard income inclusion rates upon sale.
Australia
Foreign investors in Australia must obtain approval from the Foreign Investment Review Board (FIRB) prior to acquisition and pay substantial upfront FIRB application fees plus state-level foreign buyer stamp duty surcharges (e.g., 8% in NSW and Victoria). Foreign buyers are generally restricted to purchasing newly constructed homes or off-plan developments.
United Arab Emirates (UAE / Dubai)
Dubai offers one of the world's most favorable tax regimes for international investors. In designated Freehold zones, foreign nationals enjoy 100% full land ownership rights with 0% annual property tax, 0% rental income tax, and 0% capital gains tax. Upfront entry friction is limited to a 4% Dubai Land Department (DLD) transfer fee plus registration costs.
Strategic Portfolio Optimization: Balancing Yield vs. Appreciation
Institutional portfolio managers structure real estate allocations across two distinct strategy buckets: Income-Coreand Growth-Coreassets.
Income-Core assets located in secondary or regional cities provide high immediate rental yields (6.5% to 8.5%) with lower nominal appreciation (2.0% to 3.5%). These assets provide reliable cash flow reserves that fund ongoing debt service across the portfolio.
Growth-Core assets located in high-barrier primary metros provide lower immediate rental yields (3.0% to 4.5%) but deliver stronger long-term capital appreciation (5.0% to 6.5%). A balanced investment portfolio combines both asset classes to achieve cash-flow stability alongside long-term net worth expansion.
5. 3 Worked Numerical Examples (Real World Scenarios)
Let's analyze three real-world numerical case studies across different Tier-1 markets to see how conservative appreciation math operates in practice. All calculations include entry costs, mortgage interest, inflation context, and exit friction.
Example 1: Single-Family Home in Austin, Texas (USA)
An investor purchases a suburban single-family home in Austin for $400,000 with a 20% down payment ($80,000) and a 30-year fixed mortgage at 6.5% interest. Holding period:5 years.
- Purchase Price: $400,000
- Down Payment (20%): $80,000 |Mortgage Loan: $320,000
- Estimated Nominal Appreciation:4.0% per year (Conservative local baseline)
- Inflation Rate (CPI):2.5% per year
Year 5 Future Property Value Calculation:
Future Value = $400,000 × (1.04)^5 = $400,000 × 1.21665 = $486,660
Gross Nominal Capital Gain = $486,660 - $400,000 = $86,660
Net Profit Deduction Breakdown:
- Selling Expenses (Agent commission 5% + Escrow/Title fees 1%): 6% of $486,660 = $29,200
- Mortgage Principal Paid Down over 5 years: ~$18,500
- Remaining Mortgage Balance at Year 5: $301,500
- Net Sale Proceeds = $486,660 - $29,200 - $301,500 = $155,960
- Net Gain above Initial $80k Equity = $155,960 - $80,000 = $75,960
Takeaway: Although the home only appreciated 4.0% annually, leverage expanded the initial $80,000 equity deposit into $155,960 over 5 years. However, deducting 6% in selling friction ($29,200) was essential to avoid overestimating net cash returns. To calculate total returns including rental cash flow, use our Investment Calculator.
Example 2: Buy-to-Let Apartment in Manchester (UK)
A non-resident investor buys a 2-bedroom residential flat in Manchester for £250,000. Holding period:10 years.
- Purchase Price: £250,000
- Upfront Stamp Duty (SDLT) + 2% Non-Resident Surcharge + Legal: £12,500 (as of 2026 HMRC regulations)
- Total Initial Cash Basis: £262,500
- Estimated Nominal Appreciation:3.5% per year
Year 10 Property Value Calculation:
Future Value = £250,000 × (1.035)^10 = £250,000 × 1.4106 = £352,650
Gross Capital Gain = £352,650 - £250,000 = £102,650
Deductions & Capital Gains Tax (CGT):
- Selling Agent & Conveyancing Fees (2.5%): £8,816
- Taxable Gain = £102,650 - £8,816 - £12,500 (buying costs) = £81,334
- UK Non-Resident Capital Gains Tax (24% rate on residential property as of 2026): £19,520
- Net Realized Capital Profit = £81,334 - £19,520 = £61,814
Takeaway: Without modeling the 2% non-resident SDLT surcharge and 24% UK Capital Gains Tax, an investor would have expected £102,650 in profit, whereas true net profit was £61,814. Always use our Capital Gain Calculator to model tax-adjusted net gains.
Example 3: Off-Plan Luxury Condo in Dubai Marina (UAE)
An NRI investor purchases a prime luxury condo in Dubai Marina for AED 2,000,000 cash. Holding period:7 years.
- Purchase Price: AED 2,000,000
- Upfront Dubai Land Department (DLD) Fee (4%) + Admin: AED 84,000
- Estimated Nominal Growth:5.0% per year
- Property Tax & Income Tax:0% (UAE Freehold Jurisdiction)
Year 7 Property Value Calculation:
Future Value = AED 2,000,000 × (1.05)^7 = AED 2,000,000 × 1.4071 =AED 2,814,200
Gross Capital Gain = AED 814,200
Net Profit after 2% Transfer Commission = AED 814,200 - AED 56,284 - AED 84,000 (DLD) =AED 673,916
Takeaway: UAE properties benefit from zero capital gains tax and zero annual property tax, preserving a larger portion of appreciation gains, though annual HOA service charges must be monitored closely against rental yields.
In-Depth Country Regulatory & Tax Regime Analysis
Navigating cross-border real estate appreciation requires precise understanding of localized statutory mechanisms:
United States (USA)
The US market offers 1031 Tax-Deferred Exchanges for domestic investors, allowing capital gains taxes to be deferred when rolling proceeds into like-kind property. However, non-resident foreign investors are subject to the Foreign Investment in Real Property Tax Act (FIRPTA), which requires buyers to withhold 15% of the gross purchase price upon sale unless specific exemptions are met.
United Kingdom (UK)
UK residential property transactions incur Stamp Duty Land Tax (SDLT) at progressive rates, with an additional 3% surcharge for second homes and a 2% non-resident surcharge (as of 2026 regulations). Upon exit, non-resident individuals pay Capital Gains Tax (CGT) at 24% on residential capital gains exceeding statutory annual exempt amounts.
Canada
Canada enforces strict foreign buyer measures, including the Non-Resident Speculation Tax (NRST) set at 20% in Ontario and British Columbia, alongside Federal prohibition legislation on non-resident residential purchases in specified urban centers. Capital gains on non-principal residences are subject to standard income inclusion rates upon sale.
Australia
Foreign investors in Australia must obtain approval from the Foreign Investment Review Board (FIRB) prior to acquisition and pay substantial upfront FIRB application fees plus state-level foreign buyer stamp duty surcharges (e.g., 8% in NSW and Victoria). Foreign buyers are generally restricted to purchasing newly constructed homes or off-plan developments.
United Arab Emirates (UAE / Dubai)
Dubai offers one of the world's most favorable tax regimes for international investors. In designated Freehold zones, foreign nationals enjoy 100% full land ownership rights with 0% annual property tax, 0% rental income tax, and 0% capital gains tax. Upfront entry friction is limited to a 4% Dubai Land Department (DLD) transfer fee plus registration costs.
Strategic Portfolio Optimization: Balancing Yield vs. Appreciation
Institutional portfolio managers structure real estate allocations across two distinct strategy buckets: Income-Coreand Growth-Coreassets.
Income-Core assets located in secondary or regional cities provide high immediate rental yields (6.5% to 8.5%) with lower nominal appreciation (2.0% to 3.5%). These assets provide reliable cash flow reserves that fund ongoing debt service across the portfolio.
Growth-Core assets located in high-barrier primary metros provide lower immediate rental yields (3.0% to 4.5%) but deliver stronger long-term capital appreciation (5.0% to 6.5%). A balanced investment portfolio combines both asset classes to achieve cash-flow stability alongside long-term net worth expansion.
6. Tier-1 Market Comparison: USA, UK, Canada, Australia & UAE
Capital growth dynamics differ significantly across international jurisdictions due to population growth rates, tax structures, credit availability, and regulatory constraints. Below is a detailed comparative matrix analyzing 20-year historical growth benchmarks (2006–2026 data), inflation rates, and regulatory surcharges across the five major Tier-1 markets.
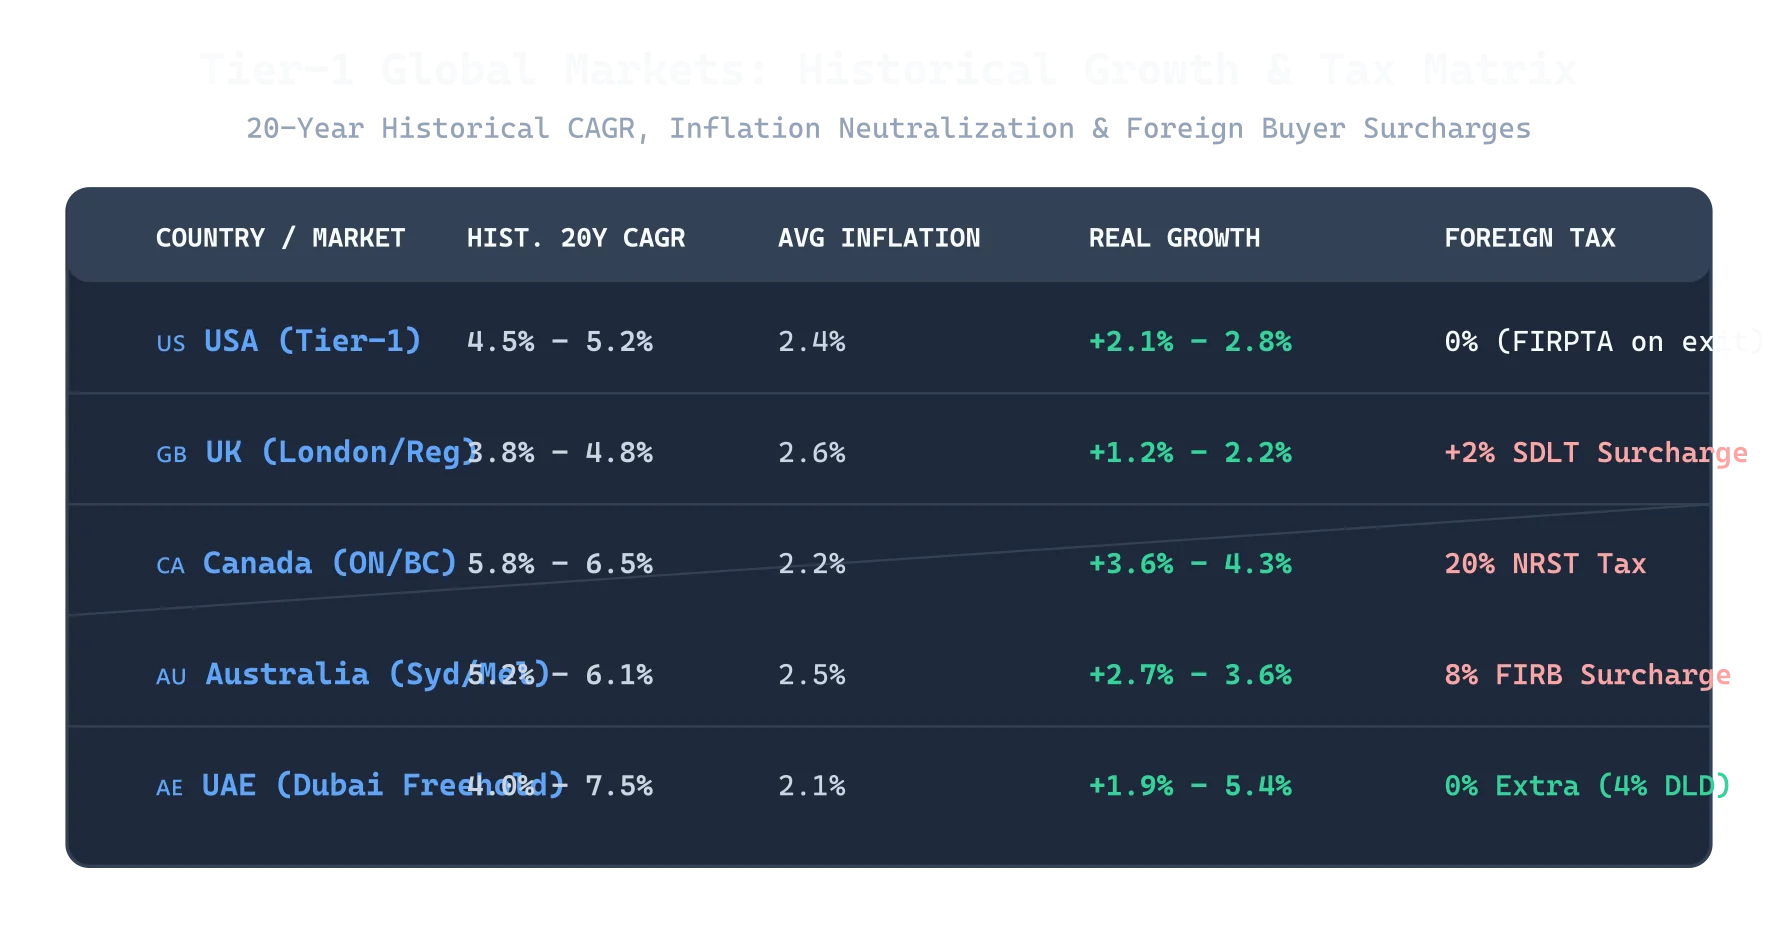
Foreign Buyer Taxes / Restrictions (as of 2026)
0% upfront in most states. FIRPTA withholding tax on sale for non-residents.
+2% SDLT Surcharge for non-residents. 24% CGT on residential gains.
20% Non-Resident Speculation Tax (ON/BC). Federal purchase rules apply.
8% FIRB Stamp Duty Surcharge. Restricted to new builds/off-plan.
0% foreign buyer surcharge in Freehold zones. 4% DLD transfer fee. 0% Tax.
Understanding these regional differences is crucial for cross-border investors. While Canada and Australia historically posted strong 20-year CAGRs, their steep foreign buyer tax surcharges (20% NRST in Canada, 8% FIRB in Australia) substantially increase initial capital requirements. Conversely, Dubai (UAE) offers 0% income and property taxes but exhibits higher market volatility across 7 to 10-year development cycles.
In-Depth Country Regulatory & Tax Regime Analysis
Navigating cross-border real estate appreciation requires precise understanding of localized statutory mechanisms:
United States (USA)
The US market offers 1031 Tax-Deferred Exchanges for domestic investors, allowing capital gains taxes to be deferred when rolling proceeds into like-kind property. However, non-resident foreign investors are subject to the Foreign Investment in Real Property Tax Act (FIRPTA), which requires buyers to withhold 15% of the gross purchase price upon sale unless specific exemptions are met.
United Kingdom (UK)
UK residential property transactions incur Stamp Duty Land Tax (SDLT) at progressive rates, with an additional 3% surcharge for second homes and a 2% non-resident surcharge (as of 2026 regulations). Upon exit, non-resident individuals pay Capital Gains Tax (CGT) at 24% on residential capital gains exceeding statutory annual exempt amounts.
Canada
Canada enforces strict foreign buyer measures, including the Non-Resident Speculation Tax (NRST) set at 20% in Ontario and British Columbia, alongside Federal prohibition legislation on non-resident residential purchases in specified urban centers. Capital gains on non-principal residences are subject to standard income inclusion rates upon sale.
Australia
Foreign investors in Australia must obtain approval from the Foreign Investment Review Board (FIRB) prior to acquisition and pay substantial upfront FIRB application fees plus state-level foreign buyer stamp duty surcharges (e.g., 8% in NSW and Victoria). Foreign buyers are generally restricted to purchasing newly constructed homes or off-plan developments.
United Arab Emirates (UAE / Dubai)
Dubai offers one of the world's most favorable tax regimes for international investors. In designated Freehold zones, foreign nationals enjoy 100% full land ownership rights with 0% annual property tax, 0% rental income tax, and 0% capital gains tax. Upfront entry friction is limited to a 4% Dubai Land Department (DLD) transfer fee plus registration costs.
Strategic Portfolio Optimization: Balancing Yield vs. Appreciation
Institutional portfolio managers structure real estate allocations across two distinct strategy buckets: Income-Coreand Growth-Coreassets.
Income-Core assets located in secondary or regional cities provide high immediate rental yields (6.5% to 8.5%) with lower nominal appreciation (2.0% to 3.5%). These assets provide reliable cash flow reserves that fund ongoing debt service across the portfolio.
Growth-Core assets located in high-barrier primary metros provide lower immediate rental yields (3.0% to 4.5%) but deliver stronger long-term capital appreciation (5.0% to 6.5%). A balanced investment portfolio combines both asset classes to achieve cash-flow stability alongside long-term net worth expansion.
7. The 8 Most Dangerous Property Appreciation Myths
Avoid these costly cognitive traps when evaluating potential real estate growth in any market:
🚨 Myth #1: "Real Estate Always Outpaces Inflation by 8%–10%"
Reality: Over 100-year historical cycles (such as the Case-Shiller index), nationwide US residential property prices have outpaced inflation by an average of only 1.5% to 2.0% per year. High double-digit surges are temporary anomalies following monetary easing or supply shocks.
🚨 Myth #2: "Past Appreciation Guarantees Future Growth"
Reality: Neighborhoods that experienced rapid gentrification over the past 5 years often face mean reversion, slowing growth as price-to-income ratios hit local affordability ceilings.
🚨 Myth #3: "Off-Plan Properties Always Appreciate Upon Handover"
Reality: Off-plan developments purchased at peak developer marketing prices frequently face valuation shortfalls at handover if local supply spikes simultaneously.
🚨 Myth #4: "Renovations Yield a $1-for-$1 Increase in Value"
Reality: According to remodeling ROI studies, luxury renovations return only 60% to 70% of their cost in appraisal value. Only structural repairs and kitchen/bathroom updates approach 80%+ payback.
🚨 Myth #5: "Negative Cash Flow is Fine Because Appreciation Will Make Me Rich"
Reality: Negative cash flow drains liquidity monthly. If a market correction forces a sale during a downturn, negative cash flow turns into permanent capital loss.
🚨 Myth #6: "Asking Price Trends Equal Realized Market Value Growth"
Reality: Listing asking prices reflect seller sentiment, not transactions. Always use verified sold-price data (like Land Registry or deed transfers).
🚨 Myth #7: "Infrastructure Projects Guarantee Immediate Price Surges"
Reality: Infrastructure appreciation is priced in long before completion. Buying after announcement often means paying top-of-market prices.
🚨 Myth #8: "High Nominal Growth Equals Wealth Creation"
Reality: If property value grows by 6% in an environment of 7% inflation, you are losing real purchasing power after accounting for maintenance and holding taxes.
Strategic Portfolio Optimization: Balancing Yield vs. Appreciation
Institutional portfolio managers structure real estate allocations across two distinct strategy buckets: Income-Coreand Growth-Coreassets.
Income-Core assets located in secondary or regional cities provide high immediate rental yields (6.5% to 8.5%) with lower nominal appreciation (2.0% to 3.5%). These assets provide reliable cash flow reserves that fund ongoing debt service across the portfolio.
Growth-Core assets located in high-barrier primary metros provide lower immediate rental yields (3.0% to 4.5%) but deliver stronger long-term capital appreciation (5.0% to 6.5%). A balanced investment portfolio combines both asset classes to achieve cash-flow stability alongside long-term net worth expansion.
8. How Appreciation Interacts with Cash Flow, Cap Rate, ROI & NPV
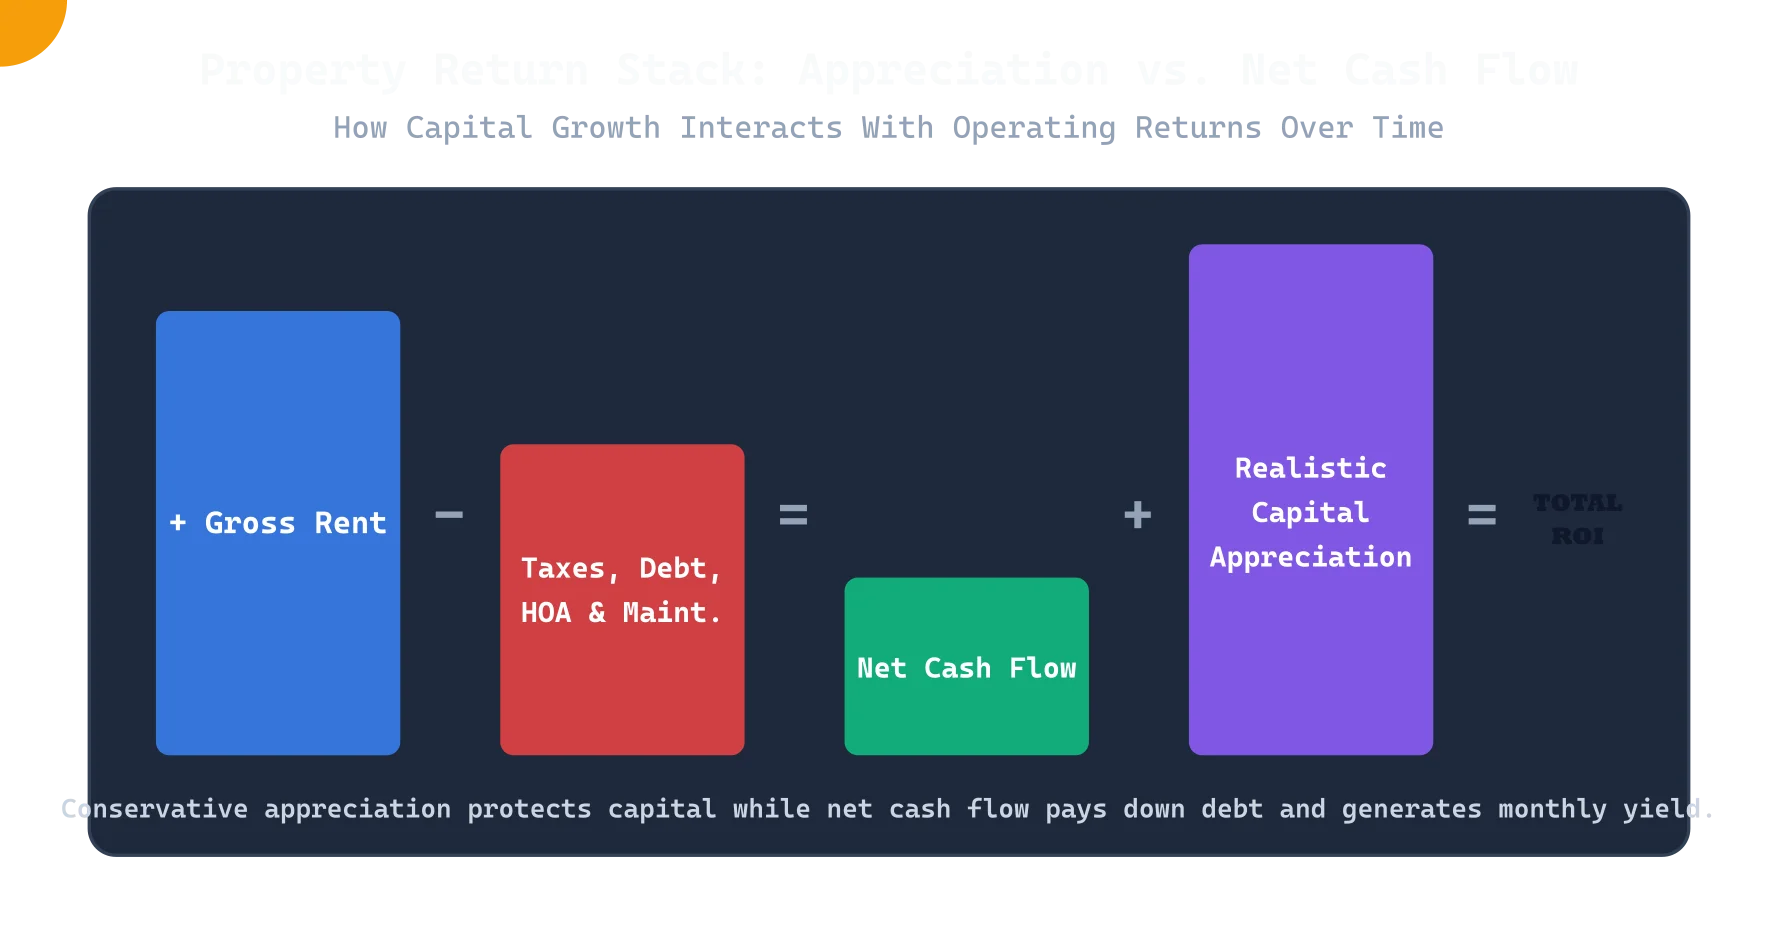
Property appreciation does not exist in isolation — it directly impacts every core investment metric across your portfolio.
A. Cap Rate Compression
When property values appreciate faster than rental income grows, the property’s Capitalization Rate (Cap Rate) compresses. For an in-depth breakdown of how Cap Rates guide investor decisions, read our guide on Cap Rate Explained for Investors.
B. Cap Rate vs. Cash Flow Dilemma
Investors frequently face a trade-off: high-growth primary metros (New York, London, Sydney) offer lower rental yields (3%–4%) with higher appreciation potential, whereas secondary cash-flow markets offer higher yields (6%–8%) with modest capital growth. Learn how to balance this in Cap Rate vs. Cash Flow: Which Metric Should Guide Your Decision?.
C. Total Return on Investment (ROI) & Net Present Value (NPV)
Total real estate ROI equals annual net cash flow plus equity growth from principal paydown plus capital appreciation gains. To discount future multi-year cash flows and exit values back to present dollars, institutional investors rely on Net Present Value calculations. Discover how to apply NPV in our guide on Using NPV for Property Investment Decisions.
To calculate your overall return across all cash streams, explore our comprehensive guide on How to Calculate ROI on a Rental Property.
Strategic Portfolio Optimization: Balancing Yield vs. Appreciation
Institutional portfolio managers structure real estate allocations across two distinct strategy buckets: Income-Coreand Growth-Coreassets.
Income-Core assets located in secondary or regional cities provide high immediate rental yields (6.5% to 8.5%) with lower nominal appreciation (2.0% to 3.5%). These assets provide reliable cash flow reserves that fund ongoing debt service across the portfolio.
Growth-Core assets located in high-barrier primary metros provide lower immediate rental yields (3.0% to 4.5%) but deliver stronger long-term capital appreciation (5.0% to 6.5%). A balanced investment portfolio combines both asset classes to achieve cash-flow stability alongside long-term net worth expansion.
9. How to Stress-Test Numbers with LashkariProperties Free Tools
Never rely on agent spreadsheets or guesswork. Before signing a contract, stress-test your numbers using the free suite of tools available on LashkariProperties.com:
Use the Property Appreciation Calculator to model 3%, 4.5%, and 6% growth scenarios over 5, 10, and 15-year holding periods.
🛠️ Step 2: Calculate Net Rental Cash Flow
Plug your mortgage EMI, property tax, insurance, HOA fees, and rental income into the Investment Calculator to verify positive cash flow.
Run your expected exit sale price through the Capital Gain Calculator to deduct selling commissions, legal fees, and capital gains tax.
10. Actionable Framework & 12-Point Investor Checklist
Print or save this 12-point due-diligence checklist before making an offer on any property:
Verified 20-year nominal CAGR from land registry data (Target: 4%–6%).
CPI subtracted to confirm positive real growth (> 1.5% p.a.).
Property breaks even or generates positive net cash flow at 0% appreciation.
No massive high-rise housing starts planned within 1-mile radius.
Walking distance (< 15 mins) to confirmed public transit hub.
Located inside top-rated local school boundary.
All foreign buyer taxes (FIRB, SDLT, NRST) factored into upfront cash.
Deducted 6%–8% for agent commissions and legal conveyancing at sale.
Calculated local CGT rates and annual allowances upon exit.
Modelled -10% market correction in Year 2; equity remains positive.
Reviewed 3 years of HOA minutes for unbudgeted special assessments.
LashkariProperties Appreciation Calculator
11. Frequently Asked Questions (PAA Style)
What is a realistic annual property appreciation rate?
Over 20–30 year cycles in major Tier-1 markets (USA, UK, Canada, Australia, UAE), realistic nominal property appreciation ranges between 4.0% and 6.5% annually. After deducting baseline consumer price inflation (CPI) of 2.0%–3.0%, real property growth typically averages 1.5% to 3.5% per year.
How do you calculate property appreciation over 5 or 10 years?
Property appreciation over time is calculated using the Compound Annual Growth Rate (CAGR) formula: Future Value = Current Value × (1 + Annual Rate)^Years. For example, a $500,000 home appreciating at 4% annually will be worth $500,000 × (1.04)^5 = $608,326 after 5 years.
What is the difference between nominal and real property appreciation?
Nominal appreciation is the unadjusted percentage rise in a home's dollar value. Real appreciation deducts general inflation. If a property appreciates by 5% in a year where inflation is 3%, your real purchasing power growth is only 2%.
Should I buy a rental property that has negative cash flow if appreciation is high?
No. Speculating on appreciation to offset negative monthly cash flow (negative gearing) carries extreme risk. If interest rates rise or market growth slows, holding costs can trigger forced liquidation. Conservative investors require properties to break even or cash-flow positively at 0% appreciation.
How does leverage impact real estate appreciation returns?
Mortgage leverage multiplies your equity growth rate. If you put 20% down ($100,000 on a $500,000 home) and the home appreciates 5% ($25,000), your gain relative to your initial invested capital is 25% ($25,000 / $100,000), minus selling costs and mortgage interest.
What local factors drive home value appreciation the most?
The strongest micro-location appreciation drivers are local job growth, wage growth, school district rankings, proximity to new transport infrastructure (rail/highways), zoning constraints limiting new housing supply, and neighborhood regeneration projects.
Do foreign buyer taxes affect long-term capital appreciation?
Foreign buyer surcharges (such as Canada's 20% NRST, Australia's 8% FIRB tax, or the UK's 2% SDLT surcharge) do not change underlying market growth, but they dramatically raise your initial cost basis, reducing net cash-on-cash ROI upon exit.
What selling costs should be deducted from total appreciation gains?
When realizing capital gains, deduct real estate agent commissions (3%–6%), legal/conveyancing fees, title transfer fees, capital gains tax (CGT), and home staging/repair expenses. Total exit costs usually account for 6% to 8% of the final sale price.
How does property appreciation relate to rental yield and Cap Rate?
Rapid capital appreciation often compresses Cap Rates and rental yields because property prices outpace rent growth. High-appreciation metro hubs frequently feature lower rental yields (3%–4%), whereas cash-flow markets offer higher yields (6%–8%) with modest growth.
What free tool can I use to model realistic growth scenarios?
You can stress-test different growth rates, inflation rates, and holding periods using the free LashkariProperties Property Appreciation Calculator at lashkariproperties.com/tools/property-appreciation-calculator.
12. Conclusion & Strategic Next Steps
Estimating property appreciation realistically is the hallmark of sophisticated real estate investors. By replacing speculative enthusiasm with conservative CAGR calculations, inflation adjustments, micro-location verification, and exit friction deductions, you protect your capital while positioning yourself for compounding wealth.
Remember: never buy a property solely for speculative capital growth. Ensure the asset breaks even or generates positive rental cash flow at 0% appreciation, and view capital growth as the accelerator rather than the foundation of your investment thesis.
Ready to analyze your next property purchase? Test your assumptions in seconds using our free suite of calculators:
- Calculate 5 to 20-year growth: Property Appreciation Calculator
- Analyze cash flow & mortgage returns: Investment Calculator
- Estimate net exit profit & taxes: Capital Gain Calculator
Written by Lashkari Real Estate Research Team
Educational Content Disclaimer: This article is for educational and informational purposes only and does not constitute personalized financial, tax, or legal advice. Real estate regulations, tax rates, and market dynamics vary by jurisdiction and are subject to change. Always consult a qualified local solicitor, accountant, or licensed financial advisor before committing capital.
Primary sources & further reading
Use these official and institutional sources when you verify local growth rates, inflation, and tax rules. Figures in this guide are educational ranges — always check the latest release for your market.
- S&P CoreLogic Case-Shiller / FRED home price index (USA)
- HM Land Registry — UK house price data
- Office for National Statistics (ONS) — UK economy & prices
- Statistics Canada — housing & prices
- Australian Bureau of Statistics — residential property prices
- Dubai Land Department (DLD)
- HMRC — Stamp Duty Land Tax (UK)
- IRS — FIRPTA overview for foreign persons (USA)
- Property Appreciation Calculator
- Investment Calculator
- Capital Gain Calculator
Related Lashkari guides: Cap Rate Explained · Cap Rate vs Cash Flow · Cash-on-Cash Return · ROI on Rental Property · NPV for Property Investment · LTV Ratio.
Sources
Related reading
Continue reading: Break-Even Occupancy for Landlords · How to Calculate Rental Yield (2026) · Cap Rate Explained for Investors. Run your own numbers with the Property Appreciation Calculator — it takes under a minute and beats guessing.
Frequently asked questions
How much do property prices appreciate per year?
Long-run appreciation in mature markets has historically averaged low single digits annually, with wide swings between cities and cycles. Treating last decade's growth as the base case for the next five years is the fastest way to overpay.
Is property appreciation guaranteed?
No. Prices are neither guaranteed nor linear; they respond to wage growth, interest rates, migration, and supply. Conservative investors treat appreciation as a bonus for buying well in supply-constrained locations, not as the reason the deal works.
How should I estimate appreciation for a purchase?
Use modest, defensible rates rather than past peaks, and stress-test with a flat path. If the purchase only works on aggressive growth, you are paying for a forecast instead of buying an asset.
What has property appreciated per year historically?
Around 3 to 4 percent annually in real (inflation-adjusted) terms over the long run in the US, UK, and Australia, with nominal returns closer to 5 to 7 percent. Individual markets vary enormously: tech metros and undersupplied cities have delivered 8 to 12 percent for decades, while slow-decline regions have gone sideways. The fatal budgeting error is assuming recent double-digit years continue — a 4 percent assumption is defensible, a 10 percent assumption is a gamble.