


Introduction: two numbers, two very different questions
Every serious property discussion eventually collides with the same argument: "Sure, the cap rate looks fine, but does the deal actually cash flow?" It is one of the most common, and most misunderstood, tensions in real-estate underwriting. Buyers who chase cap rate can end up owning technically good assets that bleed cash every month. Buyers who chase cash flow can end up in poor neighbourhoods where the yield is compensation for pain they did not sign up for.
The confusion is understandable. Both metrics look like they measure "returns". Both are quoted casually by agents, in listings, and in podcasts. Both can be produced from the same spreadsheet in the same afternoon. Yet they are engineered to answer fundamentally different questions, and a decision that relies on only one of them is a decision made half-blind.
This guide takes the argument apart with formulas, worked examples, Tier-1 market context (USA, UK, Canada, Australia, UAE), and a clear framework you can apply the next time a listing lands in your inbox. You can validate every number in this article using the free cap rate calculator and cash flow calculator on LashkariProperties — no signup, no gated PDFs, just the same math applied consistently to your own inputs.
"Cap rate tells you whether to buy the property. Cash flow tells you whether you can afford to hold it. You need both answers before you close."
Take any listing that shows a gross rent and a price, run a defensible NOI, produce an unlevered cap rate, stress-test it with real mortgage terms, and know within minutes whether you are looking at a good asset, a good deal, or neither.
Why this article exists
Search results on "cap rate vs cash flow" tend to fall into two camps. The first camp declares a winner in the first paragraph ("always chase cash flow!" or "cap rate is king!") and spends the rest of the article defending a slogan. The second camp defines both metrics correctly but never quite explains when a rational buyer should let one override the other. Neither is useful when you are staring at a live listing and a 48-hour offer window.
What follows is deliberately different. We walk through the two metrics as engineered tools that answer different questions, then we let leverage — the single most underestimated variable in retail underwriting — do most of the talking. By the end you will have a decision framework, three fully worked Tier-1 examples, and a checklist you can apply on your next offer.
Key definitions and formulas
Before we compare the two metrics, we need to define them precisely. Loose definitions are how most cap-rate vs cash-flow arguments start.
Net Operating Income (NOI)
NOI is the operating profit of the property before financing. It intentionally excludes mortgage interest, mortgage principal, income tax, and depreciation, because those items depend onwho owns the property, not the property itself.
= Gross Rental Income − Vacancy − Operating Expenses
Operating expenses include: property taxes, insurance, management fees, maintenance, utilities paid by owner, HOA/strata dues, and typically a small operating reserve.
Cap Rate (Capitalization Rate)
Cap rate is the yield an asset produces before financing. It is deliberately capital-structure neutral, which is why brokers, appraisers, and institutional investors use it to compare properties.
A 4% cap rate means the property produces $4 of NOI per $100 of price, per year — regardless of how you finance it.
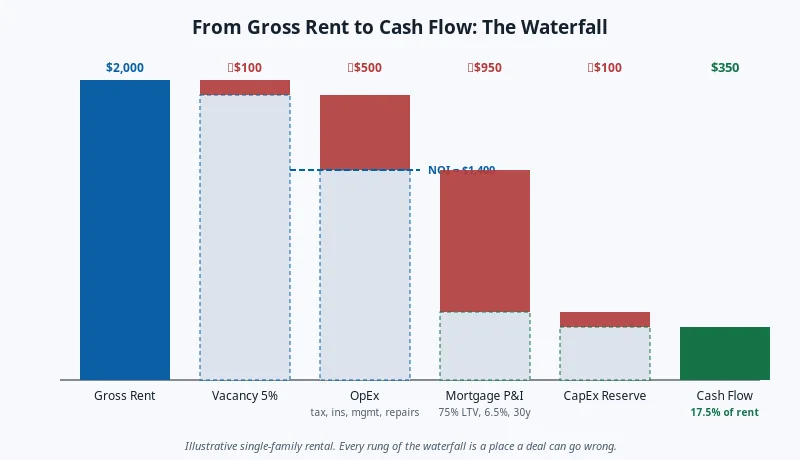
Cash flow is what actually lands in your bank account. It is levered, personal, and captures the deal you specifically negotiated with your specific lender.
Debt Service is annual mortgage principal + interest. CapEx reserves cover roofs, boilers, HVAC, and other capital items that eventually break.
Cash-on-Cash Return
A close cousin of cash flow, expressed as a percentage of the cash you actually put into the deal (down payment + closing costs + rehab).
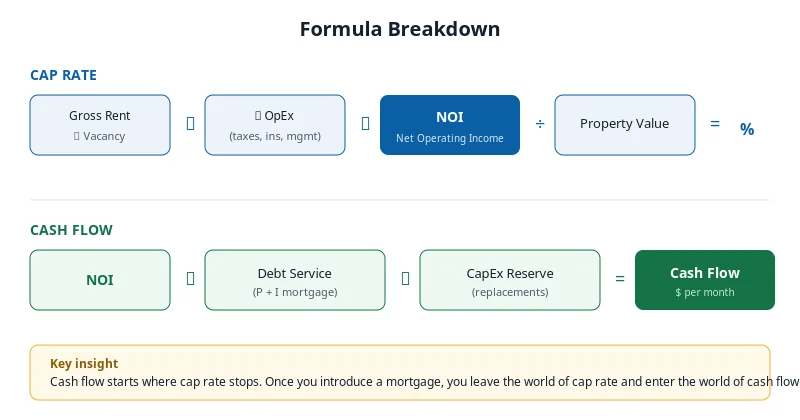
The one sentence that resolves 90% of arguments
Cap rate is a property-level metric. Cash flow is a personal-financing metric. When people argue about which is "better", they are usually arguing about two different jobs the metrics were never designed to do together.
What NOI includes and what it deliberately leaves out
Because both metrics are downstream of NOI, mistakes at the NOI line ripple into every other number. NOI is not "rent minus mortgage". Nor is it accounting profit. It is a specific operating figure with three important exclusions worth memorising.
- Excludes mortgage interest and principal. These are financing decisions, not property performance.
- Excludes income tax and depreciation. These are owner-specific and jurisdictional; they belong in your personal after-tax analysis, not in the asset yardstick.
- Excludes major CapEx. Standard NOI conventions include a modest operating maintenance line but treat roof replacement, HVAC replacement, and similar capital items separately. This is why sophisticated underwriters compute a "capital-reserved NOI" for a more honest cap rate.
Every one of those exclusions matters. If a listing quotes NOI and includes the seller's specific mortgage interest, the number is not really NOI — it is a hybrid that overstates operating performance in low-rate environments and understates it in high-rate ones. Always rebuild NOI from the rent roll and operating expenses yourself.
Why this decision matters for buyers, landlords, and investors
The gap between "the asset is good" and "the deal works for me" is where most retail investors lose money. A well-priced property in a strong sub-market can still be a losing purchase if you finance it at 85% LTV in a rising-rate environment. Conversely, a modest-quality asset can produce excellent personal cash flow if you buy it at the right price with the right capital structure.
For buyers screening dozens of properties
Cap rate is a screening tool. It normalises the numbers so that a $250,000 duplex in Ohio can be compared to a $2.4 million terraced house in North London on the same axis: yield. If you are running a pipeline of 40 potential deals a month, you do not have time to model each one in full — you need cap rate to reject 30 of them before Wednesday.
For landlords who have to make the mortgage payment
Cash flow is the only metric that matters on the 1st of the month. It is what pays the mortgage after the tenant paid rent. It is what covers the water heater that just failed. A landlord who owns three properties with negative cash flow and 40% capital growth on paper is still a landlord who lies awake at night when a boiler goes.
For investors optimising for total return
Neither metric alone is enough. Sophisticated investors combine cap rate (asset grade), cash flow (survivability), and IRR or equity multiple (total return including exit). A deal that is average on cap rate and mediocre on cash flow can still be excellent if the exit is structured around capital growth or a specific value-add plan.
For renters trying to understand a landlord's economics
Even renters benefit from understanding these metrics. A landlord operating at negative cash flow often cuts maintenance to survive; a landlord with a healthy cap-rate spread over local mortgage rates has more room to keep the property in good condition. It also informs your own decision about when to switch from renting to buying — a market where residential cap rates are compressed below the mortgage rate is one where owning is expensive relative to renting.
The role each metric plays in a mature underwriting process
In institutional real estate, the two metrics have distinct, non-overlapping jobs. Cap rate belongs to the acquisitions team: it decides whether the asset clears an investment committee's yield hurdle and how the price compares to recent comparable trades. Cash flow belongs to the asset management team: it decides whether the property covers debt service, funds reserves, and produces the distributions promised to investors. When the two teams disagree, the deal is either overpriced, over-leveraged, or being modelled with heroic rent assumptions. Retail buyers can borrow the same separation of concerns: use cap rate to decide whether a listing deserves your time, and use cash flow to decide whether it deserves your signature.
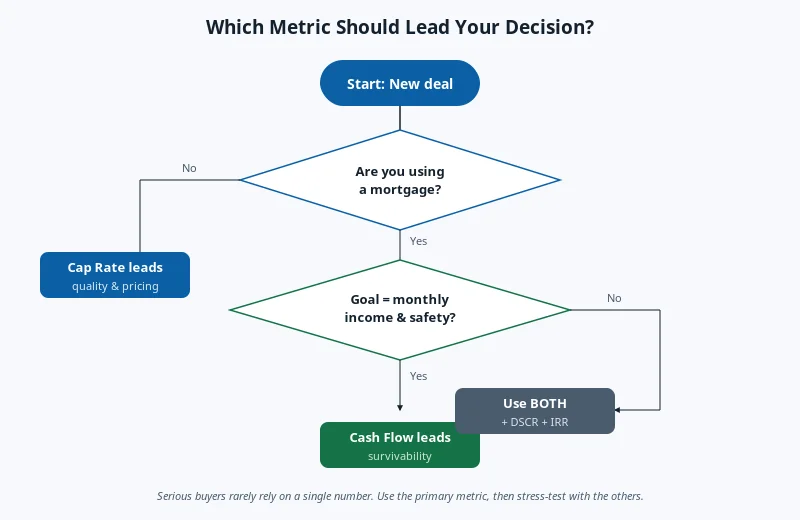
The step-by-step decision process
Here is the decision workflow we recommend for any deal that reaches the shortlist. It takes about 20 minutes per property once you have the muscle memory.
- Collect real numbers, not listing numbers. Gross rent should reflect actual market rent for the unit, not the asking rent on the listing. Cross-check on local rental portals and, where available, government rental price indices.
- Deduct a realistic vacancy allowance.5% is a common default; use higher if the local market has structural vacancy or the property is student housing or short-term.
- Deduct all operating expenses. Property tax, insurance, management (even if you self-manage — cost your own time), maintenance (a common rule is 1% of property value per year), utilities the owner pays, HOA/strata/service charges, and a small operating reserve.
- Divide NOI by the all-in purchase price."All-in" means price + closing costs + any immediate rehab. This gives an honest unlevered cap rate — the yield you would earn buying the asset with cash.
- Grade the cap rate. Compare it to local peer transactions (broker reports, MLS, LoopNet, Rightmove, Realtor.ca, Domain, Bayut) and to the local 10-year government bond yield. A cap rate that fails to beat the risk-free rate by a reasonable spread is usually a signal to walk.
- Layer in the mortgage. Enter down payment, interest rate, and amortization. Subtract annual debt service from NOI.
- Subtract a CapEx reserve.5–10% of gross rent is a healthy starting point for single-family and small multifamily.
- Divide by 12 to see monthly cash flow. If it is negative or thin, stress-test the interest rate by +1% and +2% — this tells you how the deal behaves at renewal or reset.
- Compute DSCR.NOI ÷ annual debt service. Below 1.20 is fragile territory in most Tier-1 markets. Use our DSCR calculator for this step.
- Make the decision. Only proceed if the asset passes on cap rate and the deal passes on cash flow. If it fails one, you either need a lower price, a different capital structure, or a different property.
Three worked examples
Numbers speak louder than definitions. Below are three fully worked examples designed to make the trade-off between cap rate and cash flow visible. All numbers are illustrative — not investment advice, not indicative of any specific market. Use the LashkariProperties calculators to reproduce and stress-test them with your own inputs.
Example 1: Midwest USA single-family rental — the "cash flow deal"
A three-bedroom single-family home in a stable Midwest city, purchased for $180,000 all-in, renting for $1,650 per month.
Example 1: NOI & cap rate for the Midwest SFR (unlevered view).
Now layer in a mortgage: 25% down ($45,000), 30-year amortization at a 7.0% interest rate.
Example 1 with leverage: cash flow and cash-on-cash.
On cap rate, this property looks reasonable — 6.6% is a defensible yield in a stable Midwest market. On cash flow, the deal is dangerous: about $13/month of headroom and a DSCR of 1.11 means any vacancy, any repair, or any rate reset breaks the deal. This is the classic gap between a "good asset" and a "workable deal at today's rates".
Example 2: London flat — the "capital growth play"
A one-bedroom flat in outer London, purchased at £425,000 all-in, letting for £1,850 per month.
Example 2: NOI and cap rate for the London flat.
Now layer in a UK-style buy-to-let mortgage: 25% deposit, 25-year term, 5.5% interest-only.
Example 2 with an interest-only BTL mortgage.
This is the classic London profile: the asset produces meaningful capital growth over long horizons, but the levered cash flow is often negative at prevailing mortgage rates. Cap rate says the yield is thin; cash flow says the deal is currently loss-making on a monthly basis. Whether it still makes sense depends entirely on the buyer's capital growth expectations, tax structure, and personal balance sheet. For deeper reading, our guide on interest-only mortgagesunpacks the risks and use cases.
Example 3: Dubai apartment — the "yield play"
A two-bedroom apartment in a mid-tier Dubai community, purchased at AED 1,400,000 all-in, letting for AED 95,000 per year.
Example 3: NOI and cap rate for the Dubai apartment (all-cash).
With 50% down and a 20-year mortgage at 5.75%, annual debt service is roughly AED 59,000. Levered cash flow after a 5% CapEx reserve is approximately AED 2,250 per year — thin, but positive, and DSCR is around 1.12. Reduce the down payment to 30% and cash flow turns clearly negative. This is a market where leverage is the deciding factor: cap rate says "acceptable"; cash flow says "workable only if you keep leverage moderate".
Across all three examples, the cap rate and the cash flow answer are directionally consistent but tactically different. Ignoring cap rate would let you overpay for a Midwest SFR. Ignoring cash flow would let you close on a London flat that quietly drains £2,600 a year from your current account.
How leverage rewrites the answer
Leverage is where cap rate and cash flow diverge most sharply. This is the single most important concept in the whole comparison.
The core mechanic
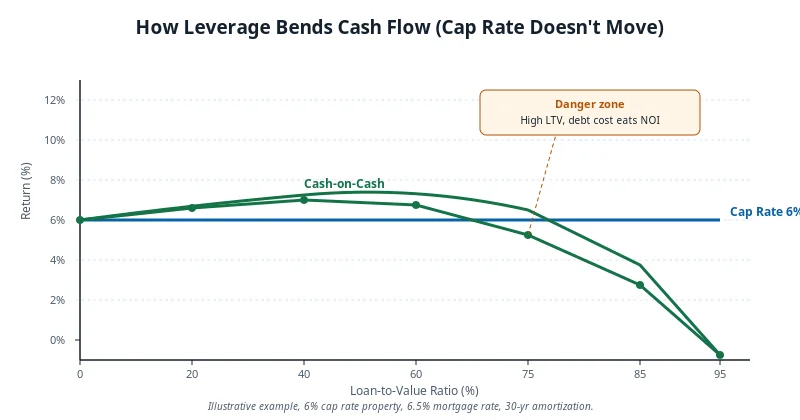
Cap rate does not move when you add or remove a mortgage. It is a property of the asset. Cash flow, however, is exquisitely sensitive to leverage. Whether leverage helps or hurts depends on a simple test: is your borrowing cost lower or higher than the cap rate?
: Mortgage rate < Cap rate → borrowing amplifies returns.
: Mortgage rate > Cap rate → each dollar borrowed shrinks cash flow.
: Mortgage rate ≈ Cap rate → leverage adds risk without adding return.
This is why a 5% cap rate property was a great buy in a 3% mortgage-rate world and a difficult buy in a 7% mortgage-rate world — the asset never changed, only the spread did. Central bank rate cycles, tracked by institutions such as the Federal Reserve, the Bank of England, and the Reserve Bank of Australia, quietly reshuffle every levered real-estate deal in the country each time policy shifts.
Positive leverage: when borrowing helps
When the asset yields more than the mortgage costs, every additional dollar borrowed is accretive to cash-on-cash return. This is the classic 2010–2021 environment in most Tier-1 markets: cap rates of 5–7% were common, and mortgage rates sat well below them. Cash flow appeared "for free" as leverage rose — up to a point.
Negative leverage: when borrowing hurts
When the mortgage rate rises above the cap rate, borrowing eats into cash flow. In this world, buyers with more equity outperform buyers with more debt, and the "leverage machine" reverses. Many high-LTV buyers who closed in 2021 discovered by 2023–2024 that their levered cash flow had swung negative on refinance — the cap rate had barely moved, but the mortgage rate had.
Leverage and volatility
Leverage does not just change the level of cash flow — it changes the volatility. A property with 25% equity swings roughly four times harder on a rent, vacancy, or rate shock than the same property purchased all-cash. Cap rate captures none of this. Cash flow, stress-tested at +1% and +2% on rates, does.
Any deal that only cash-flows at today's exact interest rate is fragile. Rate resets, refinancing shocks, and lender re-underwriting are normal features of long real-estate holds, not tail risks. Model at least a two-percentage-point stress, and check the DSCR calculator at the stressed rate.
Tier-1 market nuances
Cap rate and cash flow behave differently across Tier-1 property markets. A one-size-fits-all rule ("always demand 8%!") ignores the real reasons yields diverge across countries. Here is how the picture actually varies.
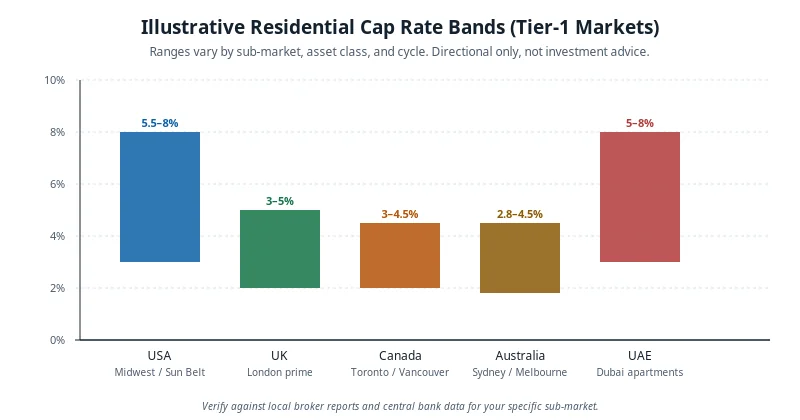
The U.S. is not one market. Coastal metros (San Francisco, Boston, NYC, LA) trade at compressed cap rates of 3.5–5% for residential, driven by capital-growth expectations and institutional demand. Sun Belt and Midwest metros regularly trade at 5.5–8% for single-family rentals. Landlord-friendly states with lower property taxes and lighter eviction rules tend to trade at tighter yields than headline numbers imply, because operating expenses are lower. Data from the U.S. Census Bureau housing surveys is a useful cross-check on rents and vacancy trends.
UK residential cap rates are among the lowest in Tier-1 markets, particularly in London and the South East. A 3.5% net yield is not unusual for a prime one-bedroom flat. The BTL sector has been reshaped since 2016 by mortgage interest relief changes, additional stamp duty on second homes, and stricter private-renting regulation. Serious BTL underwriting today requires stress-testing against ICR (interest coverage ratio) thresholds set by lenders, which are effectively a stricter version of DSCR.
Canada
Toronto and Vancouver residential cap rates frequently sit in the 3–4.5% band, similar to prime London, with a heavy capital-growth thesis embedded. Provincial rent-control regimes in Ontario and BC limit rent growth on existing tenancies, which compresses NOI upside and makes cap-rate expansion harder. Alberta, by contrast, has historically offered wider spreads. Central bank policy at the Bank of Canadamaterially resets levered cash-flow calculations each cycle.
Australia
Sydney and Melbourne residential cap rates are structurally low — often below 4% — because the market has priced in decades of population-led capital growth. Many Australian investors accept negative gearing (deliberately negative cash flow) in exchange for tax offsets against ordinary income and expected capital gains. This is a legal, common strategy in Australia, but it is one that shifts the whole conversation away from cash flow and toward total return. The RBA Statement on Monetary Policyis worth reading before making any leveraged Australian purchase.
Dubai and Abu Dhabi residential markets offer notably wider cap rates than most Tier-1 peers — 5–8% is common for apartments — largely because there is no personal income tax, service charges and chiller costs are significant, and the market has historically been more cyclical. Mortgage financing is available but generally at lower LTVs than in Western markets, and buyers should factor in the local property fee structure published by the Dubai Land Department.
Compare the local cap rate to the local 10-year government bond yield. The spread — not the absolute cap rate — tells you how much you are being paid for the incremental risk of owning property in that market. A 4% cap rate over a 1% bond yield can be more attractive than an 8% cap rate over a 6% bond yield.
Common mistakes and myths
These are the recurring errors that surface when buyers, agents, and even seasoned landlords argue about cap rate and cash flow. Each one has cost real people real money — often in ways that only become obvious two or three years after closing.
Myth 1: "A higher cap rate is always better"
False. A high cap rate is compensation for risk. It typically appears in markets or sub-markets with weaker capital growth, higher vacancy, less liquid resale, or greater tenant risk. If you are being paid 9% instead of 4%, the market is telling you something — the discipline is to decide whether you accept the risks being priced in.
Myth 2: "Cash flow is the only real return"
False. Cash flow is one component of total return. In markets with structural capital growth and tax-advantaged treatment, ignoring appreciation can lead to systematically rejecting deals that outperform on IRR. Cash flow protects survivability; capital growth protects long-run wealth.
Myth 3: "If the listing says the cap rate is 7%, then it's 7%"
Listings notoriously overstate cap rates. Common tricks include using pro-forma rents rather than in-place rents, omitting management fees on "owner-managed" units, understating property taxes based on a stale assessment that will reset on sale, and skipping CapEx reserves entirely. Rebuild the number yourself using the cap rate calculator.
Myth 4: "Cash flow this month means cash flow every month"
False. Rental cash flow is lumpy. A tenant turnover eats a month or two of rent. A furnace failure eats a year of margin. A rate reset can flip the whole equation overnight. Averaged cash flow is meaningful; single-month cash flow is not.
Myth 5: "Cap rate already includes CapEx"
Only partially. Standard NOI calculations often include a modest maintenance line but exclude larger capital reserves for roofs, HVAC, and major renewals. If you want a fully honest cap rate, subtract a CapEx reserve from NOI before dividing by price — this gives a "capital-reserved cap rate" that most institutional underwriters implicitly use.
Myth 6: "DSCR replaces cash flow"
False. DSCR is a lender's ratio. It tells you whether the property can service the loan on paper, not whether you as owner have any money left after the loan is serviced, taxes are paid, and reserves are funded. A DSCR of 1.25 can coexist with modest personal cash flow. Read our guide to DSCR for investors for the deeper picture.
Myth 7: "Gross rent multiplier is a shortcut for cap rate"
Only very roughly. GRM ignores operating expenses entirely, which is exactly the piece of NOI that varies most across markets. A property with a 10× GRM in a low-expense market and one in a high-expense market can have very different real cap rates. Our article on the Gross Rent Multipliercovers when it is useful and when it misleads.
Myth 8: "Appreciation will save a thin cash flow deal"
Appreciation is a return you receive if and when you sell — cash flow is a return you receive every single month. Substituting one for the other in a live underwriting model is a category error. Historical appreciation numbers, even in strong Tier-1 markets, contain long flat periods and outright drawdowns. Assuming smooth compounding to rescue a fragile deal is how negative-cash-flow portfolios accumulate. If your thesis genuinely depends on appreciation, you should be explicit about the assumed exit price, the assumed hold length, and how much monthly cash you are willing to lose in the meantime.
Myth 9: "Cap rate compression is always good news"
Cap rate compression looks great when you are the seller and terrible when you are the buyer. When cap rates in a market fall from 6% to 4%, existing owners see their values rise on paper, but new buyers face a much harder cash-flow arithmetic. It is entirely possible for a market to be simultaneously enriching current owners and punishing new entrants. Understanding where in that cycle you are buying is often more important than the specific cap rate on any individual listing.
How this connects to related property metrics
Cap rate and cash flow do not exist in isolation. They form a family of metrics that each answer a slightly different question.
The metric family, mapped to the question each one answers.
Comparing assets across buyers and markets
The best underwriters do not pick one metric; they line them up as a scorecard. Cap rate to screen, cash flow to underwrite, DSCR to check refinance risk, and IRR or ROI to compare across asset classes. If any single number sings too loudly, that is usually the number worth double-checking. See our companion piece on calculating cash-on-cash return for the levered mirror of cap rate, and our deeper cap rate explainer for the foundational metric.
Run the numbers with free LashkariProperties calculators
Every worked example in this guide can be reproduced — and stress-tested with your own inputs — in a few minutes using the free calculators on LashkariProperties. None require signup.
Step 1 — Grade the asset
Start with the Cap Rate Calculator. Enter your gross rent, vacancy assumption, and operating expenses to produce a defensible NOI and cap rate. Compare it against the peer transactions and government bond yields discussed above.
Step 2 — Test survivability
Feed the same property into the Cash Flow Calculator, layering in your specific mortgage terms and CapEx reserves. Look at monthly cash flow at today's rate, then re-run the numbers at +1% and +2% to see how fragile the deal is.
Step 3 — Verify lender comfort
Use the DSCR Calculatorto check that the property meets typical lender thresholds — usually 1.20 to 1.25 minimum for investment mortgages. A property that passes cash flow but fails DSCR will struggle at refinance.
Step 4 — Compare across your portfolio
Finally, use the ROI Calculatorto place the deal on the same axis as other opportunities — different asset classes, different markets, different capital structures. This is where cap rate and cash flow become two inputs to a bigger decision, rather than the whole decision themselves.
Ready to pressure-test a specific deal?
Open the calculators side by side and see how cap rate and cash flow move on the exact property you are considering.
An actionable framework and checklist
Here is the practical checklist we recommend keeping alongside any live deal. Print it, screenshot it, or save it — the value is in going through it every time, not once.
- I have used realistic in-place market rent, not asking rent from the listing.
- Vacancy assumption reflects local conditions, not a generic 5% default.
- Operating expenses include property tax, insurance, management, maintenance, and reserves.
- Property tax is modeled at the post-purchase assessed value, not the previous owner's basis.
- Cap rate is calculated on the all-in cost, including closing costs and any immediate rehab.
- Cap rate has been benchmarked against at least three peer transactions in the sub-market.
- The cap rate exceeds the local 10-year government bond yield by a spread I can defend.
- Levered cash flow is positive at today's rate.
- Levered cash flow remains acceptable at a rate stress of +2 percentage points.
- DSCR is 1.20 or higher at today's rate, and at least 1.05 at the stressed rate.
- I have separated CapEx reserves from operating maintenance, and both are funded.
- My decision is grounded in the metric that fits my role (buyer, landlord, investor).
- I have a documented plan for what I would do at rate reset or unexpected vacancy.
- I have factored in local rules, taxes, and regulations, or planned to verify them locally.
If you cannot honestly tick every box, the deal is either not ready to underwrite or not ready to close. There is no shame in walking. The best real-estate investors say "no" far more than they say "yes".
Frequently asked questions
Neither is universally more important. Cap rate is the better tool for judging whether the asset itself is priced well and how it compares to peers. Cash flow is the better tool for judging whether you personally, with your specific loan, can survive month to month. Serious buyers use both — cap rate to screen, cash flow to underwrite.
A good cap rate depends entirely on the market and asset class. Residential cap rates in London, Toronto, Sydney, and other tightly supplied capitals often sit between 3% and 5%, while U.S. Sun Belt or Midwest single-family rentals and Dubai apartments frequently trade in a 5% to 8% band. A cap rate is "good" when it fairly compensates you for the risk and growth outlook of that specific sub-market.
Leverage does not change the cap rate — it changes your realized cash flow and cash-on-cash return. If your mortgage rate is lower than the cap rate, borrowing amplifies returns (positive leverage). If your mortgage rate is higher than the cap rate, each additional dollar borrowed shrinks cash flow (negative leverage). The higher your loan-to-value, the more sensitive cash flow becomes to interest-rate moves.
Can a property have a great cap rate and terrible cash flow?
Yes — this happens whenever the cap rate is close to or below the borrowing rate. A 6% cap-rate property financed at a 7% mortgage rate typically produces negative levered cash flow, even though the underlying asset looks solid on paper. This is the classic gap that trips up buyers who screen deals only on cap rate.
Can a property have great cash flow and a terrible cap rate?
Yes, though less commonly. A property might cash flow well because you put down 60% equity, or because you assumed an older, low-rate mortgage. The unlevered cap rate could still be mediocre, meaning the asset itself is not particularly efficient — the cash flow comes from your capital structure, not the building.
No. Cap rate is intentionally unlevered. It divides Net Operating Income by property value, where NOI is calculated before debt service. This makes cap rate comparable across buyers who have different loans, and across markets where borrowing conditions vary.
Should I buy a property with negative cash flow?
Only with eyes wide open. Some investors accept negative cash flow when they are underwriting a specific value-add plan, buying in a market where they expect strong capital growth, or using tax-advantaged structures. But every month of negative cash flow is a month you must fund from other income. Never assume you will "grow into" cash flow — model the deal at today's rents, today's rates, and today's vacancy assumptions.
How does cap rate relate to cash-on-cash return?
Cap rate measures return on the full property value. Cash-on-cash return measures return on the cash you actually put in. If you buy all-cash, they will be similar (differing only by CapEx reserves). If you use a mortgage, cash-on-cash can be much higher — or much lower — than cap rate depending on the spread between the cap rate and your borrowing cost.
No. DSCR is a solvency ratio — it tells the lender whether NOI comfortably covers your mortgage. Cash flow tells you what actually lands in your bank account after all costs. Lenders care about DSCR; you also need to care about cash flow, because a DSCR of 1.25 can still mean modest monthly income after CapEx reserves and personal taxes.
How do I compare markets with very different cap rates?
Do not compare in isolation. A 3.5% cap rate in central London and an 8% cap rate in Cleveland are pricing different things — growth, currency, tenant risk, liquidity, and rule-of-law premiums are all embedded. Compare cap rate spreads over the local risk-free rate (typically the 10-year government bond yield) and, where possible, over local mortgage rates. That spread tells you how much extra you are being paid for the risk relative to safe assets in that market.
No — a properly calculated cap rate uses NOI, and NOI already subtracts a realistic vacancy allowance from gross rent. If a listing quotes cap rate based on 100% occupancy at asking rent, treat that number with skepticism and rebuild the calculation with a market-realistic vacancy assumption.
Which metric matters most for a first-time landlord?
For a first-time landlord using a mortgage, cash flow is usually the more emotionally and financially critical metric. The reason is simple: cash flow is what pays for the boiler that breaks, the tenant who leaves, and the tax bill you did not expect. Cap rate helps you decide whether to buy the property; cash flow helps you decide whether you can afford to hold it.
Advanced applications and edge cases
Once the basics are internalised, there are a handful of advanced applications where the interplay of cap rate and cash flow gets genuinely interesting. These are worth knowing even if you never intend to use them, because they show up constantly in broker pitches and podcast underwriting.
Exit cap rate and the "reversion" question
Serious underwriting does not stop at today's cap rate. It also models the cap rate you assume when you sell — the "exit cap" or "reversion cap". A common institutional convention is to assume the exit cap is 25 to 50 basis points higher than the going-in cap, to reflect ageing of the asset and general conservatism. This single assumption has an outsized effect on IRR, often more than year-one cash flow. When a pitch deck shows heroic IRR figures, it is almost always because the exit cap has been quietly assumed to be lower than the going-in cap — a bet that the market will pay more for the property in the future than it does today.
Value-add plays and the NOI ramp
Value-add investing deliberately targets deals where in-place cap rate is unattractive but stabilised cap rate — after rent bumps, unit renovations, or expense controls — is compelling. Cash flow in year one is usually thin or negative. Cash flow by year three, if the plan works, is meaningfully higher. This is a legitimate strategy but one that magnifies execution risk. If you cannot deliver the NOI ramp, you are stuck with the going-in cash flow forever. Investors underwriting value-add should model both a base case and a "plan misses by 25%" case; if the latter still cash flows adequately, the deal has a genuine margin of safety.
Portfolio effects: blending cap rate and cash flow across multiple assets
Investors with more than one property often mix strategies deliberately — a high-cap-rate cash-flowing property in the Midwest paired with a lower-cap-rate growth property on the West Coast, for example. The portfolio's overall cash flow can absorb the drag from the growth asset because the cash-flow asset carries it. This is a mature approach that recognises no single metric wins every environment. It also disciplines you into thinking about correlation: two properties in the same sub-market are one bet, not two.
Refinance and cap rate expansion risk
The most under-appreciated risk in leveraged property investing is refinance risk. A five-year mortgage that ends in a higher-rate world can turn a cash-flowing deal into a losing one at renewal — even if nothing about the property changes. Cap rate is silent on this risk; cash flow catches it only if you stress-test forward-looking rates. Every leveraged buyer should know their loan maturity date, their assumed refinance rate, and what their cash flow looks like at that stressed refinance. Our DSCR calculator is useful for this — a DSCR that comfortably clears 1.25 today but falls below 1.10 at a stressed refi rate is a warning sign.
Currency and cross-border considerations
Buyers investing across borders — a UK investor buying in Dubai, a Canadian buying in Florida, a Gulf investor buying in London — face an extra layer that neither cap rate nor cash flow captures directly: currency. A 6% USD cap rate can become a 3% return in your home currency if the dollar weakens. Cash flow that looks strong in local currency can be volatile once repatriated. Long-horizon investors sometimes hedge these exposures, but retail buyers often do not, which means the effective cash flow can differ meaningfully from the modelled cash flow. Cross-border investors should always underwrite in both the property's local currency and their own home currency, and understand that the difference between them is a bet, not a rounding error.
Conclusion and next steps
Cap rate and cash flow are not rivals. They are two lenses on the same deal. Cap rate is how the market grades the asset — a clean, capital-structure-neutral yardstick that lets you compare a duplex in Kansas City to a flat in Kensington on the same axis. Cash flow is how your deal will feel on the 1st of every month — sensitive to leverage, rates, vacancy, and reserves, and specific to the exact loan you signed.
The best decisions come from using them in sequence: cap rate to screen for a fairly priced asset, cash flow to underwrite a survivable deal, and DSCR and IRR to sanity-check the wider picture. The worst decisions come from picking one number, defending it, and closing.
The next practical step is to pick a real listing you are considering and put it through the full workflow. Start with the cap rate calculator, move to the cash flow calculator, then pressure-test with the DSCR calculator and finally the ROI calculator. Twenty focused minutes with the four tools will tell you more about a deal than a week of scrolling listings.
Then read alongside: our foundational explainer oncap rate for investors, the levered mirror in cash-on-cash return, and the lender's-eye view in DSCR explained. Together they form the underwriting stack that separates emotional decisions from disciplined ones.
Underwrite your next deal like a professional
Free calculators, no signup, and consistent math applied to every property you evaluate.
In-house team of property analysts covering investment underwriting, mortgage mechanics, and market data across USA, UK, Canada, Australia, and the UAE.
Disclaimer. This article is educational content, not personalised financial, tax, or legal advice. Numbers, cap-rate ranges, and market examples are illustrative only and do not reflect any specific transaction or predict future returns. Rules on taxation, mortgage eligibility, landlord licensing, and rent regulation differ significantly by country, state or province, and municipality — including across the United States, United Kingdom, Canada, Australia, and the United Arab Emirates — and change over time. Always verify current rules and run your own numbers with a qualified local professional (accountant, mortgage broker, solicitor, or licensed real-estate advisor) before making an investment decision.
Sources
Related reading
Continue reading: Break-Even Occupancy for Landlords · How to Calculate Rental Yield (2026) · Cap Rate Explained for Investors. Run your own numbers with the Cap Rate Calculator — it takes under a minute and beats guessing.
Frequently asked questions
Cap rate or cash flow: which matters more?
Both, for different questions. Cap rate tells you whether to buy the property — it compares the asset on an unlevered basis. Cash flow tells you whether you can afford to hold it once the mortgage is in place. You need both answers before you close.
When does cap rate matter most?
When you are comparing two properties in the same market without financing attached, cap rate isolates the asset's performance from your deposit and rate. It is the fairest way to shortlist deals.
When does cash flow matter most?
Once a loan is involved. A strong cap rate means little if the monthly numbers leave you short after the mortgage, vacancy, and repairs. Stress-test cash flow with a vacancy year, because the hold is what keeps you in the deal.
Why is a property with a low cap rate still a good investment?
Because cap rate ignores leverage, taxes, and appreciation. A property bought at a 4 percent cap rate in a city with strong rent growth can beat a 9 percent cap rate in a shrinking market, because the value appreciation and rent escalations compound. Cap rate prices current income; total return prices the future. Serious investors screen with cap rate but decide with cash flow and projected total return.