


We are not going to give you a 2026 house-price index target. Those numbers age badly, and they are the wrong object for a personal decision. What you can do is name the forces that move almost every market, then test whether your purchase still works if those forces go the wrong way. A family that can carry a higher rate, a flatter price path, and a slower sale is less dependent on whoever has the loudest forecast this quarter.
Property is local in the details and global in the plumbing. A rate decision in a reserve bank, a wave of migration into one city, a planning system that takes seven years to deliver a neighbourhood, and a lender that suddenly wants a larger deposit will do more to your outcome than a television debate about whether the market is 'hot' or 'cooling.'
Disclosure and scope
This is an educational framework, not a ranking of countries or a personalised buy, sell or hold recommendation. LashkariProperties may display advertising and provide property tools; an advertisement is not an endorsement, and readers should independently verify a property, lender offer, tax position and ownership rules before acting. The figures in this article are illustrative unless a linked source or dataset is named.
At a glance
- Do not begin with a country forecast; begin with the exact city, property type, currency and holding period.
- Stress the payment one and two percentage points above the quoted rate, then include taxes, insurance, fees and a repair reserve.
- Compare achieved rent with the full ownership cost, allow for vacancy, and check how quickly you could sell in a slower market.
- Use the linked calculators for your own numbers, then record the official sources and check dates beside each time-sensitive assumption.
Interest rates set the size of the bid
Most buyers are not cash buyers. They are payment buyers. For a given income and a given lender rule, a higher interest rate shrinks the loan they can carry, which shrinks the price they can bid. A lower rate does the opposite. This channel is boring and it is the one that explains more national price swings than architecture or taste.
The useful personal version is not 'where will rates be in December.' It is 'what payment appears if my rate is two points higher than the quote I like, and does the household still function.' If the answer is no, you do not have a rate view. You have a fragility. Fixed-rate periods delay that test; they do not delete it, unless you can repay the loan before the fix ends.
Supply is late on purpose
Homes are slow to approve, slow to fund, and slow to build. When demand jumps, prices and rents move first. Completions arrive years later, if they arrive at all. When demand falls, the homes already started still complete, which is why some markets look oversupplied just as buyers step back. This lag is not a failure of intelligence. It is the physics of land, labour, and permission.
Markets with tight geography or tight planning tend to express demand as price. Markets that can sprawl or that issue permits easily tend to express demand as more buildings. Neither is automatically a better investment. The first can punish you with a high entry price and reward you if scarcity holds. The second can cap your growth and still be a fine place to live. Know which machine you are stepping into.
Demographics are the background hum
Households, not people, consume dwellings. A city that forms many new households — young adults leaving home, migration, divorce, longer lives in smaller units — needs more roofs even if the headline population is only inching up. A city that is ageing in place, with grown children staying put and little inward migration, can have slack even when the tourist brochure still looks busy.
Migration is lumpy. It clusters in the cities with jobs, universities, and existing communities. National averages hide that. A country can look balanced while two metros run hot and a third empties. If your thesis is 'this country always goes up,' you do not have a thesis. If your thesis is 'this employment market keeps forming households faster than this planning system can respond,' you at least have a mechanism.
Credit conditions are not the same thing as the policy rate
Two countries can have similar headline rates and very different housing markets because lenders are not equally willing. Deposit floors, stress tests, debt-to-income caps, valuation haircuts, and the simple mood of credit committees all change how much of a theoretical mortgage becomes a real offer. When credit loosens, more of the demand that already existed can bid. When credit tightens, the same incomes produce fewer transactions and softer prices, even if the central bank has not moved.
This is why watching only the policy rate is not enough. Watch what borrowers like you are actually being offered: the deposit, the stress rate, the term, the fees. A 0.25 point cut that arrives with a stricter stress test can leave you with less buying power, not more.
Worked stress test on a USD $380,000 purchase
A household earning USD $78,000 wants a USD $380,000 home. All dollar amounts in this worked example are illustrative USD; replace them with your local currency and current quoted costs before making a decision. They can put down 15 percent, or $57,000, and borrow $323,000. At 6.4 percent over 30 years the principal-and-interest payment is about $2,020. Add $420 for tax and insurance and $85 for an association fee. The housing outgoing is about $2,525 a month, or 39 percent of gross income, before utilities and repairs.
Now raise the rate two points, which is the sort of shock a variable loan or a refix can deliver, and the principal-and-interest piece becomes about $2,461. The full housing outgoing is about $2,966, or 46 percent of the same gross income. That is $441 more every month, $5,292 a year. It is also the difference between a budget with a holiday and a budget that treats a broken washing machine as an event.
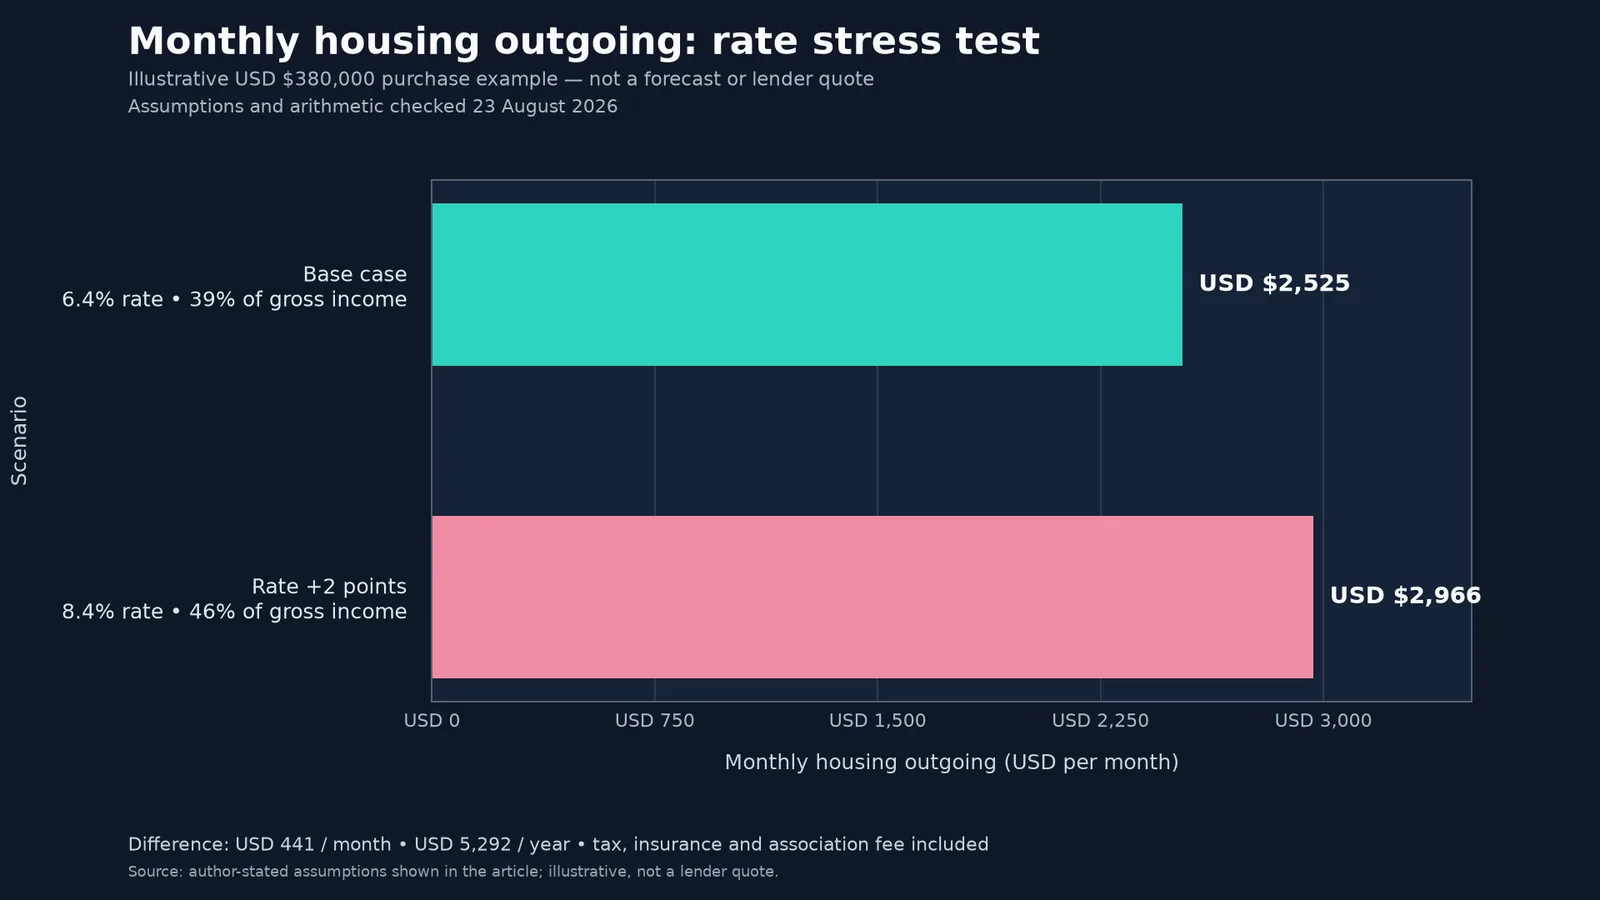
Read the chart numerically
| Scenario | Rate | Principal and interest / month | Total housing outgoing / month | Gross income share |
|---|---|---|---|---|
| Base case | 6.4% | USD $2,020 | USD $2,525 | 39% |
| Rate +2 points | 8.4% | USD $2,461 | USD $2,966 | 46% |
Download the stress-test CSV to copy the inputs into a spreadsheet. The payment uses standard monthly amortisation on the stated principal, annual rate and 30-year term; taxes, insurance and the association fee are then added as fixed monthly costs. Replace every illustrative value before relying on the result.
Reproducible stress-test inputs
| Input | Illustrative value | How to replace it |
|---|---|---|
| Purchase price | USD $380,000 | Use the actual asking or agreed price in your local currency |
| Down payment | 15% / USD $57,000 | Use cash available after transaction costs and reserves |
| Loan and term | USD $323,000 over 30 years | Use the lender’s principal, term and repayment type |
| Base and stress rates | 6.4% and 8.4% | Use the quoted rate, then test one and two points higher |
| Other monthly housing costs | USD $505 | Replace with current tax, insurance, association fee and maintenance allowance |
| Gross household income | USD $78,000 per year | Use stable income before bonuses and uncertain future raises |
- Base case: $2,525 a month, about 39 percent of $78,000
- Rate +2 points: $2,966 a month, about 46 percent of $78,000
- Price path of 0 percent for five years: still $380,000, and sale costs would make a move backwards on paper
- Price path of 3 percent a year for five years: about $440,500 before costs
- If this is a rental, add a four-month void and ask whether the reserve survives
None of these paths is a forecast. They are a way of asking whether you need the friendly path in order to stay solvent. If you do, the purchase is a bet on the friendly path. If you do not, you can afford to ignore a lot of commentary.
How to read a market without outsourcing your nerve
Look at the stock of homes for sale and how long they sit, not only at last month's median price. Medians move because the mix of what sold moved. Time-on-market and the gap between asking and done prices tell you about negotiating power. Look at rents next to prices if you are an investor; a market where prices ran far ahead of rents is asking you to pay for growth that has already been capitalised. Look at who is allowed to lend and on what terms. Then look at your own time horizon. A three-year stay and a fifteen-year stay are not the same product, even at the same address.
Cross-border buyers should add two more forces: currency, and the political permission to own. A home that is stable in local currency can still lose for you if your own currency strengthens. A market that welcomes foreign capital can change the welcome. Neither is a reason never to buy abroad. Both are reasons to avoid a purchase that only works if the exchange rate and the rulebook stay still.
A five-minute market check
- Name the exact city, neighbourhood and property type; a national average is only a starting point.
- Write down the payment at the quoted rate and again one and two points higher.
- Use a defensible rent, a realistic vacancy allowance, and every owner cost you can evidence.
- Set a reserve for at least six months of housing costs, and longer for a rental or cross-border purchase.
- Choose an exit window and ask whether you could sell in a slower market without needing the forecast to rescue you.
- Record the official sources and the date you checked them, then repeat the check when the rate, rules or property changes.
Common mistakes
- Treating a national headline as if it describes your street
- Using last cycle's price growth as the base case for the next five years
- Ignoring credit rules and watching only the policy rate
- Buying a payment you can carry only at the teaser rate
- Needing to sell inside a window the local market cannot guarantee
- Collecting forecasts instead of running a personal stress sheet
How to use the free calculators
Start with the Home Affordability Calculator and use the income you actually have, not the income you expect after a promotion. Then open the Mortgage Calculator and re-run the same loan at a rate one and two points higher than the quote. If the payment only works on the friendly rate, that is your answer. Use the Property Appreciation Calculator to see a flat five years and a modest growth path side by side, so a purchase that requires rapid appreciation is visible as a requirement rather than a hope.
The forces to watch in the markets you might buy in
We are not going to print price forecasts, because a forecast with a date is a liability the moment the date passes. But the forces each market is arguing with are knowable, and watching them is more useful than reading predictions. In the United States, compare the mortgage-rate context in the Federal Reserve FOMC materials (checked 23 August 2026) with a local price series such as the FHFA House Price Index rather than treating a national signal as your mortgage quote. In the United Kingdom, check the Bank of England monetary-policy summary (checked 23 August 2026) alongside the ONS private-rent and house-price release (published 20 May 2026; checked 23 August 2026). In Australia, migration-driven demand in the big cities meets one of the developed world's heaviest household-debt loads, so compare the Reserve Bank cash-rate page (checked 23 August 2026) with ABS residential property-price indexes. In the UAE, the cycle is exposed to investor and expat demand, off-plan supply pipelines in Dubai and Abu Dhabi, and global capital flows; use the Central Bank monetary-policy page (checked 23 August 2026) and the ADREC property dashboard for local market evidence. Rental returns are property-specific, so compare current rent, vacancy, service charges, financing cost and ownership rules rather than relying on a headline yield. In every one of these, the personal version of the question is the same: what happens to my payment, my vacancy, and my exit if the force turns against me?
- US: rate levels, existing-home supply, and affordability limits on the bid
- UK: fixed-rate resets, regional demand splits, and the planning-reform debate
- Australia: migration, heavy household debt, and lender serviceability rules
- UAE: expat and investor demand, the off-plan pipeline, and global capital flows
A comparable market scorecard
| Market | Watch first | Personal question | Starting source |
|---|---|---|---|
| US | Mortgage rates, existing-home supply, affordability | Does my payment survive a higher rate and a slower sale? | Federal Reserve — FOMC (checked 23 August 2026) · FHFA House Price Index |
| UK | Fixed-rate resets, regional demand, planning | Can I hold through a refix and still cover the full ownership cost? | Bank of England — Monetary Policy (checked 23 August 2026) · ONS rent and house prices (20 May 2026) |
| Australia | Migration, household debt, serviceability rules | Does the deal work if the lender stress test is stricter than the headline rate? | Reserve Bank of Australia — Cash rate (checked 23 August 2026) · ABS property-price indexes |
| UAE | Expat demand, off-plan supply, global capital | What happens to rent, vacancy and resale if foreign demand cools? | Central Bank of the UAE — Monetary policy (checked 23 August 2026) · ADREC property dashboard |
How to score a market without pretending it is a forecast
Score each target city and property type from 1 (weak evidence or poor fit) to 5 (strong evidence and good fit), using the same five criteria: payment resilience 30 percent, rent-and-price data quality 20 percent, supply-and-demand evidence 20 percent, ownership and exit complexity 15 percent, and your reserve and holding-period fit 15 percent. The weighted result is score ÷ 5 × weight for each criterion, added together; for example, a 4/5 payment-resilience score contributes 24 of 30 points. Re-score when rates, rent, vacancy, rules or your income changes. This is a transparent decision aid, not a ranking or a prediction of returns.
| Target market | Price/rent evidence to collect | Check before using the result |
|---|---|---|
| US metro (for example, New York or your target city) | FHFA price series plus a local rent series | Property type, metro definition, mortgage quote and HOA/tax treatment |
| UK region (for example, London or your target area) | ONS rent and house-price series | Region, tenure, refix date, service charge and stamp-duty position |
| Australian capital (for example, Sydney or Melbourne) | ABS capital-city price indexes plus local rent evidence | Dwelling type, lender serviceability, vacancy and state-level costs |
| Dubai or Abu Dhabi | ADREC or local authority transaction/rental dashboard | Freehold zone, ownership eligibility, service charges, off-plan handover and resale liquidity |
Rent-price signal guide
| Observed signal | What it may suggest | What to verify before acting |
|---|---|---|
| Prices rising faster than defensible rents | Yield may be compressing and future growth may already be priced in | Comparable achieved rents, vacancy, service charges, financing cost and your hold period |
| Rents catching up while prices pause | Income yield may be recovering without a headline price boom | Lease quality, tenant demand, maintenance, insurance and local rent rules |
| High headline yield with weak demand | The yield may compensate for vacancy, property or resale risk | Actual occupancy, days to let, tenant quality, repairs and realistic exit price |
| Low yield in a supply-constrained area | Scarcity may be part of the return thesis, but income may not cover debt | Planning pipeline, lender terms, reserve size, tax and whether you can hold through a flat market |
Rent versus price: what the ratio is telling you
The gap between prices and rents is one of the cleanest signals an investor can read without a data subscription. When prices run far ahead of rents, yields compress and the market is asking buyers to pay today for growth that may or may not arrive. When rents catch up — through wage growth, migration, or a price pause — yields recover without anyone announcing it. Neither condition is automatically a buy or sell signal; a low yield can be rational in a genuinely supply-constrained city, and a high yield can be a warning about the tenant market. But the ratio forces you to say which story you are buying, and a purchase that requires both a high yield and rapid appreciation is usually a purchase that is asking too much of one asset.
Build a personal resilience plan, not a forecast
Since nobody can tell you where prices will be in three years, the grown-up move is to design a purchase that survives the unkind path. Fix or stress your rate two points higher than the quote and confirm the payment still fits. Carry a reserve that covers six months of the full housing cost, and twelve if the property is a rental. Model a longer vacancy than the agent's brochure implies, a flatter price path than the last cycle, and a slower sale than the current market's marketing times. If the purchase still works on all three, you can ignore most of the commentary. If it only works on the friendly path, the forecast you are relying on is your own.
- Stress the rate: can the payment survive two points higher?
- Reserve: six months of housing costs, twelve if it is a rental
- Vacancy: model a longer void than the brochure suggests
- Exit: could you sell in a slower market without distress?
- If it only works on the friendly path, you are betting on the forecast
Currency: the cross-border buyer's quiet variable
If you are buying outside your home currency, exchange rates can move more than the property does. Consider a USD $300,000 purchase financed from a currency that moves 10 percent against the dollar over the transaction. If your currency weakens, the same $300,000 suddenly costs about $333,000 of your money — a 10 percent tax that appears nowhere in the local listing and is invisible to the local agent. If your currency strengthens, you get the reverse: an automatic discount. This is why cross-border buyers are effectively long two assets at once: the property and the exchange rate.
- A 10 percent currency move on $300,000 changes your cost by about $30,000
- The local price, the rent, and the yield are all quoted in a currency that is not yours
- Fixed-rate pegs, like the UAE dirham's dollar link, remove one variable but not the others
- Hedge only what you understand; for a single purchase, timing and a rate-lock are usually enough
The practical habits cost nothing: watch the rate for a few months before you commit, get a currency specialist's quote rather than a bank's default rate, and build a 5 to 10 percent buffer into your budget for currency movement during the transaction. A home that is a good buy at 1.25 to your currency can be a poor buy at 1.10, with the same price tag on the door.
Sources
- Federal Reserve — FOMC monetary policy (checked 23 August 2026)
- Bank of England — Monetary Policy Summary and minutes (checked 23 August 2026)
- Reserve Bank of Australia — Cash rate target (checked 23 August 2026)
- Central Bank of the UAE — Monetary policy (checked 23 August 2026)
- Knight Frank — Global house price index (checked 23 August 2026)
- OECD — Analytical house price database (checked 23 August 2026)
Related reading
Continue reading: Break-Even Occupancy for Landlords · How to Calculate Rental Yield (2026) · Cap Rate Explained for Investors. Run your own numbers with the Home Affordability Calculator — it takes under a minute and beats guessing.
Frequently asked questions
What will happen to house prices in 2026?
No one knows, and forecasts with dates age badly. What is knowable is the set of forces — rates, supply, migration, credit rules — and how your purchase performs if they turn against you. Stress-test your own payment and reserve, and you need the forecast less.
Are property prices going to fall?
Markets fall when buyers can no longer bid: when rates rise faster than incomes, credit tightens, or supply outpaces demand. Watch the stock of homes for sale, time on market, and your local affordability, and judge your own exposure rather than a national headline.
Where is the best property market to invest in 2026?
The best market is the one you can buy, finance, and hold with your own numbers — not the one with the loudest growth story. Compare net yield, vacancy norms, tax, and your exit options in the US, UK, Australia, and UAE against your own budget before choosing a market at all.
How do interest rates affect house prices?
Most buyers are payment buyers: a higher rate shrinks the loan they can carry, which shrinks the price they can bid. A two-point rate rise on the $380,000 example above lifted the housing outgoing by $441 a month — enough to remove a family from the market entirely.
Is 2026 a good time to buy a house?
That is a household question, not a market question. If the payment fits at a stressed rate, the reserve is intact, and the timeline is flexible, most years are workable. If you need the friendly forecast to stay solvent, no calendar year makes that safe.
Should I wait for prices to drop before buying?
Waiting works when prices fall and you are ready to move; it fails when prices rise while you save, or when the market turns and lending tightens at exactly the moment you qualify. Run your numbers at today's payment and a stressed one, and compare against the cost of waiting rather than a guess about the market.
Which property markets are strongest heading into 2027?
The article does not rank future winners because the answer depends on the city, property type, financing, tax, vacancy and time horizon. Compare current local population and employment data with housing completions, achieved rents, lender terms and exit liquidity. A market is only strong for you if the deal still works after a stressed rate, a realistic vacancy allowance and a slower sale.
This article is educational. It is not a market forecast, an investment recommendation, or financial advice. National and local conditions change, and your household is not an index. Stress-test the numbers, then speak to a qualified adviser if you need a personal recommendation on a specific purchase or loan.