


What is the Gross Rent Multiplier?
The Gross Rent Multiplier, usually written as GRM, is the number of years of gross rental income a property would take to pay for itself, ignoring every cost of ownership. It is the property market's answer to the price-to-earnings ratio in equities — a fast, universal way to sort listings by relative value.
Because GRM only needs two numbers you can find in any real estate advertisement — the asking price and the rent — investors can run it in their heads while scrolling. A three-bedroom terrace in Manchester listed at £280,000 with a monthly rent of £1,400 has a GRM of about 16.7. That single number lets an investor immediately say "expensive for a rental" or "worth a closer look" long before they open a spreadsheet.
But the same simplicity that makes GRM useful also makes it dangerous. It ignores taxes, insurance, service charges, vacancy, capital expenditure, financing and management. Two properties with an identical GRM of 12 can produce wildly different real returns — one might yield 6% net, the other 2%. Used well, GRM is the fastest filter in an investor's toolkit. Used badly, it turns cash flow negative deals into "bargains".
The metric first appeared in mid-twentieth-century US brokerage practice, when small residential deals lacked the standardised operating statements that commercial appraisers relied on. Brokers needed a way to talk about relative value using the two data points they could always confirm — the asking price and the going rent. Seventy years later, the underwriting stack has grown vastly more sophisticated, but the reason GRM survives is unchanged: it is the only property metric that fits in a text message.
The right mental model is not "GRM is a valuation number" but "GRM is a triage number". In an emergency room, triage does not decide who survives. It decides who is examined first. That is exactly the job GRM should be doing at the top of your funnel — separating listings worth an hour of your time from listings worth thirty seconds.
In one line
GRM is a screening ratio, not a valuation. Use it to reject listings, not to buy them.
The GRM formula in one line
The standard formula is:
Some US listing sites quote amonthly GRM based on monthly rent — a number roughly twelve times larger. Both are valid, but never mix them. In this guide we always use annual GRM, which aligns with international convention and with the way most brokers report deals in London, Sydney, Toronto and Dubai.
The inverse: gross rental yield
If GRM is price divided by rent, gross rental yield is rent divided by price. They carry identical information, expressed differently:
- GRM of10⇔ gross yield of10%
- GRM of 12.5⇔ gross yield of8%
- GRM of20⇔ gross yield of5%
- GRM of 33.3⇔ gross yield of3%
US investors talk in multiples; UK, Australian and UAE investors mostly talk in yields. Both camps mean the same thing. If you can flip effortlessly between the two, you can compare a Dubai Marina apartment quoted at "7.2% gross" against a Los Angeles duplex quoted at "GRM 11.5" in one glance.
Effective GRM: a small tweak that saves careers
Sophisticated underwriters rarely use raw GRM. They use aneffectivevariant that subtracts an assumed vacancy rate from gross rent before dividing. If you assume 8% vacancy in a market like Charlotte or Manchester, effective gross rent on a $18,000/year property becomes $16,560, which pushes the effective GRM up by about 8.7%. The difference between a "GRM 11" and an "effective GRM 12" is the difference between a deal that pencils and one that does not — especially when interest rates are elevated.
A second useful variant is the pro-forma GRM, which uses projected market rent for a property currently rented below market. Do this transparently: label the calculation "pro-forma", never present it to a partner or lender as the operating GRM, and always show the current, in-place figure alongside it. Confusing the two is one of the most common ways deals blow up during due diligence.
Why investors, buyers and landlords still use GRM
In an age of automated valuation models and AI-powered comps, why does a formula this crude still survive? Three reasons:
1. It works at the speed of a listing feed
A serious investor may screen 200 listings a week. Calculating cap rate, DSCR and cash-on-cash for each is impossible without underwriting software. GRM is fast enough that it can act as a first filter — if the GRM is unreasonable, no deeper analysis is warranted.
2. It only requires public information
Every listing shows a price. Local rental comparables are easy to find on Zillow, Rightmove, realestate.com.au, Realtor.ca, Bayut and Property Finder. Cap rate, in contrast, needs operating expenses that are almost never disclosed at listing stage.
3. It normalises across property sizes and prices
A £220,000 flat and a £1.2 million detached house look nothing alike, but their GRMs sit on the same scale. That makes GRM a natural way to compare relative value across a submarket.
4. It doubles as a language for negotiation
When you offer £245,000 for a listing priced at £280,000, "I offered 3% below asking" tells the seller nothing. "At £280,000 the GRM is 16.7 — the last three sold comparables closed at an average GRM of 14.9" tells them exactly why you priced where you did, and it is very hard to argue with. Every experienced investor eventually learns that GRM is not only a screening tool — it is also the fastest way to justify a lower offer to a seller who thinks their property is exceptional.
5. It is the metric your competitors are using
Whether you like GRM or not, most private landlords, small syndicators, buy-to-let investors, and international property buyers screen with it because it is what listing portals surface. If you are competing for the same properties, you need to know exactly where the market is drawing the line — and where irrational buyers are pushing GRMs beyond it.
"GRM is the property market's spellchecker — it will not write your business plan, but it will catch obvious errors before you send anything."
How to calculate GRM in five steps
The formula is trivial. The discipline is in the inputs.
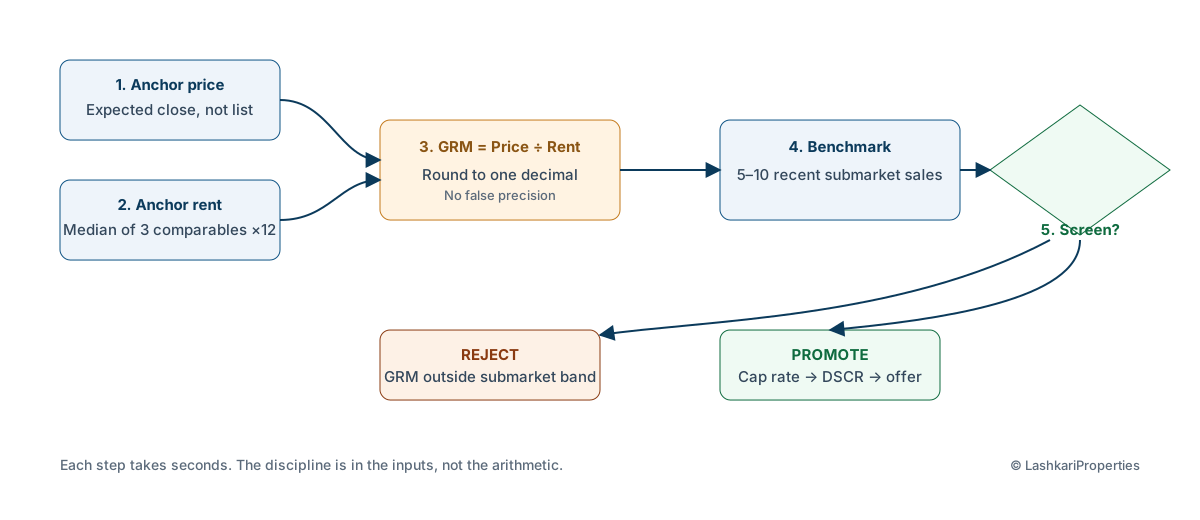
Step 1 — Anchor the price
Do not use the list price if it is clearly above comparable sales. In a soft market, plan on paying 3–8% below asking; in a hot market, expect to pay 2–5% above. Run GRM at the price you realistically expect to close at, not the number in the headline.
Step 2 — Anchor the rent
Take three current, comparable rental listings of the same bedroom count, condition and location. Use the median, not the average, and never the top of the range. Multiply by 12 to convert to gross annual rent.
Step 3 — Divide
GRM = Price ÷ Gross Annual Rent. Round to one decimal place. Anything beyond that suggests false precision.
Step 4 — Benchmark against the submarket
A GRM of 14 means nothing in isolation. Look at 5–10 recent sold listings on the same street or postcode. If the neighbourhood average is 11, a GRM of 14 signals the property is 25% more expensive per pound of rent than its peers. Ask why.
Step 5 — Decide: screen or reject
If GRM is inside your target range, promote the listing to the next stage of analysis (cap rate, DSCR, cash flow). If GRM is above your ceiling with no obvious reason (view, land size, redevelopment potential), reject.
Speed vs accuracy: how long each step should take
The whole five-step routine should take a disciplined investor less than 90 seconds per listing. Anchoring price against three comparables: 20 seconds. Anchoring rent against three comparables: 30 seconds. Division and rounding: instant. Submarket benchmark comparison: 20 seconds if you keep a live spreadsheet of your local GRM band. Decision: instant. If your GRM screen is taking longer than that, the problem is not the arithmetic — it is that you have not yet built the reference data (submarket GRM bands, expected transaction discount, achievable rent) that turns GRM from an isolated calculation into a comparative judgement.
What to record about every rejected listing
Rejected listings are the most valuable data in your funnel, because they define the shape of the market. For every listing you reject, log four fields: the postcode, the bedroom count, the GRM at close-expected price, and the reason for rejection. Over three months, that log becomes a heat map of where GRM discipline is being ignored by the market and where it is being enforced. Investors who keep this log discover buying opportunities others miss — for example, a submarket where GRMs quietly compress by two full points over six weeks is nearly always signalling a genuine value shift.
A note on precision
Do not report GRM to more than one decimal place, and never report gross yield to more than one decimal place either. Both inputs — price and rent — are estimates with real-world uncertainty of at least a few percent. A GRM of "12.437" implies a precision your data does not have. Rounding to "12.4" (or better yet, banding into ranges like "12–13") forces you to think in terms of intervals of confidence, which is how professional underwriters actually reason.
Best practice
Every serious investor keeps a private table of "acceptable GRM by submarket". A GRM of 15 might be a screaming buy in San Diego and a laughable overpay in Cleveland. Build your own benchmarks — do not import someone else's from the internet.
Three worked examples
Numbers make the traps visible. The three examples below use round figures on purpose, so the arithmetic stays transparent and reproducible.
Example 1 — A "cheap" duplex in the US Midwest
A duplex in a working-class Cleveland suburb is listed at US$220,000. Each unit rents for US$200/month, so gross annual rent is US$26,800.
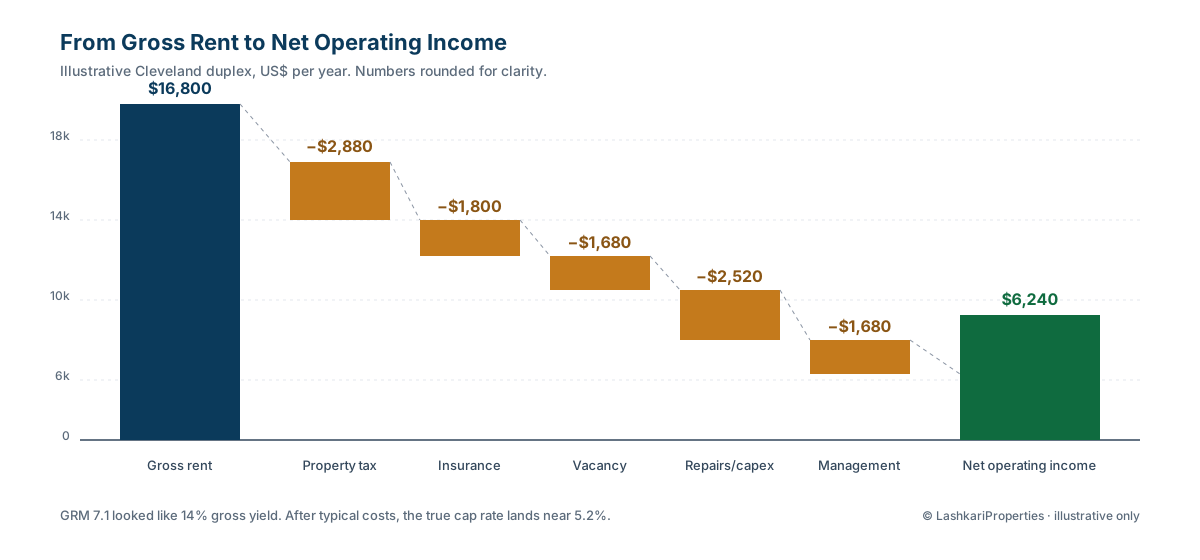
GRM = 120,000 ÷ 16,800 = 7.1. The gross yield is 14%. On paper, extraordinary.
But run the full stack:
- Property tax: 2.4% of value = $2,880
- Insurance: $1,800
- Vacancy allowance at 10%: $1,680
- Repairs & capex reserve at 15% of rent: $2,520
- Property management at 10%: $1,680
Total operating cost: $10,560. Net operating income (NOI) = 16,800 − 10,560 = $6,240. True cap rate = 6,240 ÷ 120,000 = 5.2%. The "14% yield" turns into just over 5% before financing, and probably 2–3% cash-on-cash after a mortgage. The low GRM did not lie — it just described a completely different animal from the one an inexperienced investor imagined.
Now overlay financing. At a 25% down payment ($30,000) and a 30-year fixed at 7.0%, annual debt service on the $90,000 loan is roughly $7,190. Post-debt cash flow: 6,240 − 7,190 =−$950. The property is cash flow negative, despite screening at a spectacular GRM of 7.1. Anyone who bought on the GRM alone signed up to feed the property $80 every month, hoping appreciation would eventually save them. In a market where prices have historically grown at 2–3% per year, that hope is a poor foundation for a buy decision.
Example 2 — A prestige apartment in London
A one-bedroom flat in Zone 2 London is listed at £560,000. Achievable rent is £2,100/month, so gross annual rent is £25,200.
GRM = 560,000 ÷ 25,200 = 22.2. Gross yield is 4.5%.
A US-trained investor would recoil. But once you subtract 1% service charges, 15% management on furnished lets, and a 3.5% vacancy for a strong central location, the net yield settles near 2.8%. That is a losing deal on cash flow alone — unless capital growth carries it. Historic Zone 2 growth of 4–5% per year turns the deal into a 7–8% total return. GRM alone cannot see that. It was never meant to.
The London example illustrates a broader truth: in appreciation-led markets, GRM is essentially a proxy for the market's implicit growth forecast. A GRM of 22 embeds an assumption that either rents will rise, prices will rise, or both. When Bank of England policy shifts, or when supply constraints break (as they have in some outer boroughs), those embedded assumptions can invert almost overnight. Investors who treat a London GRM of 22 as "normal" are effectively long the growth story without having explicitly underwritten it.
Example 3 — A new-build studio in Dubai Marina
A studio in Dubai Marina is listed at AED 950,000. Long-term rent is AED 68,000/year.
GRM = 950,000 ÷ 68,000 = 14.0. Gross yield is 7.1%.
Because the UAE has no annual property tax and no income tax on rental income for individual owners, more of the gross rent survives into net. Applying 10% for service charges (very high in Marina), 8% for management, and 8% for vacancy, net rent lands at ~AED 51,000. Net yield ≈ 5.4%. In a tax-free jurisdiction, that outperforms the London flat despite a much lower GRM headline. This is why raw GRM cannot be compared across tax regimes without adjustment.
The Marina example also demonstrates the danger of ignoring service charges. On a $260,000 studio, AED 20,000+ per year in service charges is not unusual in the newer towers. That single line item can turn a headline GRM of 14 into an effective GRM of nearly 18 once you gross up the price for the capitalised value of the charges. Any investor screening Dubai listings must always ask for the service-charge schedule before treating the GRM as meaningful.
A fourth example — an Australian regional house
A four-bedroom house in Adelaide's northern suburbs is listed at A$240,000 with achievable rent of A$220/week — A$27,040/year.
GRM = 540,000 ÷ 27,040 = 20.0. Gross yield is 5.0%.
Subtract 0.7% council rates, 0.25% water and emergency services levy, 8% management (Australian norm), 5% vacancy allowance, and a 0.4% annual maintenance reserve on the build. Net rent lands at around A$20,500 — net yield 3.8%. This is a mixed-return market: cash flow modest, but South Australian land tax is favourable to sub-A$200k holdings, and Adelaide's ten-year price growth has averaged over 6% per year. The Australian investor's playbook of stacking three or four of these houses across a portfolio and letting time — not GRM — do the work is a rational answer to a market where the GRM ceiling is structurally high.
A fifth example — a Toronto condo compared with a Calgary duplex
Consider two Canadian deals side by side. A one-bedroom Toronto condo at C$280,000 rents for C$2,600/month: GRM = 21.8, gross yield 4.6%. A Calgary duplex at C$240,000 rents for C$2,300/month total: GRM = 13.6, gross yield 7.3%.
On GRM alone the Calgary deal is more than 50% better "value per dollar of rent". Layer in the operating stack — Toronto has strict rent control under the Ontario Residential Tenancies Act, plus condo fees that can approach C$200/month; Calgary has a lighter regulatory regime, but Alberta has faster tenant turnover and larger vacancy swings during commodity downturns. Neither deal is unambiguously better; they simply express different investment theses. The Toronto condo is a bet on federal immigration policy and long-run price appreciation; the Calgary duplex is a bet on current cash flow and commodity-cycle resilience. GRM does not choose between those theses — it just quantifies the trade-off.
Cross-example takeaway
Across all five examples the pattern is identical. GRM sorted the listings into approximate buckets almost instantly, but every buy-or-pass decision required at least one more metric. The Cleveland duplex looked cheap, and once we added expenses and financing it was cash flow negative. The London flat looked expensive, and once we added a defensible growth thesis it became a reasonable long-hold. The Dubai studio looked mid-range, and tax structure made it competitive. The Adelaide house looked expensive by US standards, and Australian land-tax dynamics made it rational. The Canadian pair looked like a landslide for Calgary until regulatory and macro overlays evened the score. In every case, GRM did its job — it just refused to do anyone else's.
Not financial advice
All example numbers are illustrative and rounded. Tax treatment, allowable deductions and lender criteria differ by country, state and personal circumstances. Verify your own figures with a qualified local professional before making any investment decision.
Tier-1 market nuances
The same GRM means different things in different jurisdictions. Below is a rough map of what "normal" looks like today in Tier-1 markets. Treat the ranges as reference points, not targets.
Typical residential GRM ranges by Tier-1 market (2026 reference)
US Midwest & South (Cleveland, Memphis, Birmingham AL)
US Sun Belt metros (Phoenix, Tampa, Charlotte)
UK regional (Manchester, Leeds, Birmingham UK)
Why the same GRM is not equivalent across countries
Four structural forces distort cross-market comparisons:
- Property taxes.A 2%+ annual property tax in Texas or New Jersey can consume a fifth of gross rent. UK council tax is paid by tenants; UAE has no annual property tax at all.
- Income tax on rent. Section 24 in the UK, negative gearing in Australia, and 0% personal income tax in Dubai all bend the after-tax yield away from the GRM headline.
- Financing structure.A US 30-year fixed mortgage produces radically different cash flow than a UK 5-year fix or a UAE 25-year variable at 6%.
- Currency and inflation.A Toronto or Sydney investor evaluating US Midwest deals must adjust for FX volatility that can outweigh the yield gap.
Local rules to check before trusting a GRM
These are common friction costs that quietly erode the "gross" in GRM:
- USA:transfer tax, HOA fees, state-level rent control (e.g. California AB 1482).
- UK:stamp duty land tax surcharge on additional dwellings, ATED for company-held properties, leasehold ground rent.
- Canada: land transfer tax, non-resident speculation tax in Ontario and BC, rent-control rules in Ontario and Manitoba.
- Australia: land tax (state-level), foreign investor surcharges in NSW and Victoria, strata levies.
- UAE:4% Dubai Land Department transfer fee, service charges (can exceed AED 25/sq ft in prime towers), Ejari registration.
For readers researching individual regulations, primary sources such as the UK Government's Stamp Duty guidance, the US Consumer Financial Protection Bureau, the Dubai Land Department, and the Reserve Bank of Australia housing statistics are more reliable than any listing portal.
When GRM misleads you
GRM fails silently — the number looks reasonable while the underlying deal is broken. Six situations account for most of the damage.
1. Below-market rents on the current lease
A landlord who has not raised rent in five years may show a GRM that flatters the listing. The moment the tenant leaves and rent resets to market, the "GRM 11" property becomes GRM 9 — but the seller pockets the premium. Always calculate GRM at current market rent, not in-place rent.
2. Pro-forma or seasonal rent
Short-term rental (STR) listings quote peak-month revenue extrapolated across a year. A ski chalet earning $8,000 in February does not earn $96,000 annually. If a listing shows an implausibly low GRM, check whether it is built on 12 × peak rent.
3. High-expense property types
Older houses, waterfront homes, high-rise apartments with premium HOA/service charges, and student HMOs all carry above-average operating cost ratios. Their GRM must be lower than average to deliver the same net yield.
4. High-tax jurisdictions
A New Jersey duplex at GRM 9 can lose to a Tennessee duplex at GRM 12 once property tax is applied. GRM alone cannot see the tax difference.
5. Deferred maintenance
Sellers who defer roof replacement, boiler service or exterior painting for five years will list at "market" prices but transfer a hidden capital expenditure liability. A GRM of 10 with $40,000 of imminent capex is really a GRM of 12.4.
6. Financing shock
GRM ignores mortgages, but mortgages do not ignore you. In 2020 a 3% US mortgage made a GRM of 20 workable. In 2026 at 6.5%, the same GRM often produces negative cash flow. GRM is stable; the environment around it is not.
7. Concessions, incentives and "free rent"
In softening rental markets — pockets of Toronto condos in 2025, oversupplied Melbourne CBD apartments in 2026 — landlords increasingly offer one or two months' free rent to secure a tenant. The advertised rent looks unchanged, but the effective annual rent is 8–17% lower. A GRM calculated from advertised rent will look better than a GRM calculated from the actual cash the property generates. Always ask what the effective, concession-adjusted rent looks like across a full year.
8. Inclusions in the rent
UK HMO rents often include utilities. Some UAE listings include chiller charges. A few US Class-C multifamily leases include heat. Any rent that includes a service the landlord must pay for is not directly comparable to a rent that does not. GRM treats those numerators as equivalent when they are not.
Warning
If the GRM looks miraculous, assume the seller has priced in a risk you have not seen yet. GRM below the submarket median by more than 25% almost always signals hidden cost, hidden vacancy, or hidden tenant risk.
Common GRM mistakes and myths
Myth 1 — "Low GRM = good deal"
Only if the low GRM is not caused by high expenses, poor location, or above-market current rent. Bargain-hunting on GRM without a cost audit is the single most common way novice investors buy money-losing rentals.
Myth 2 — "GRM works for any asset class"
It works reasonably well for single-family homes and small multifamily. It fails for commercial office, retail, industrial, hospitality and STR — where lease structures and non-rent income dominate.
Myth 3 — "GRM benchmarks are universal"
There is no global "good GRM". A GRM of 12 is expensive in Detroit and cheap in Sydney. Only compare within a submarket.
Myth 4 — "GRM tells me my return"
GRM tells you nothing about return on invested capital. It ignores the mortgage — the single largest expense for a leveraged investor. Use cash-on-cash return and DSCR for that.
Myth 5 — "GRM handles vacancy"
Not by default. The "gross rent" in GRM assumes 100% occupancy. In a market with 10% seasonal vacancy, the effective GRM should be about 11% higher than the headline.
Myth 6 — "Higher GRM always signals a bad deal"
A high GRM can be perfectly rational in a strong-appreciation market. Sydney and Vancouver investors historically earned most of their return from capital growth, not rent. High GRM there means "the market believes future price growth will make up for weak yield".
Myth 7 — "A single GRM number captures a market"
"The GRM in Manchester" or "the GRM in Phoenix" does not exist. A one-bedroom flat above a takeaway on a rough street is a different asset from a two-bedroom terrace three streets over, even if their broad market label is identical. GRM benchmarks must be built at postcode/ZIP + bedroom-count + condition granularity, not city-wide averages. Investors who use city-level medians consistently overpay in premium micro-markets and reject genuine bargains in unloved ones.
Myth 8 — "GRM is obsolete because we have automated valuation models"
AVMs are excellent at estimating price, but they do not price a property against its rental income — they price it against its physical and locational comparables. GRM performs an entirely different job: it evaluates the relationship between price and rent, which is what an investor actually cares about. AVMs and GRMs are complements, not substitutes.
Mistakes to avoid — quick checklist
- Using list price instead of expected purchase price.
- Using top-of-range rent from a single listing.
- Mixing monthly and annual GRM conventions.
- Comparing GRMs across countries or asset classes.
- Skipping the cap rate and DSCR check after GRM.
- Trusting the GRM printed on the listing itself.
GRM vs cap rate, yield, cash-on-cash and DSCR
GRM is the first metric in a stack. Each metric below fixes something GRM ignores.
How GRM relates to other property investment metrics
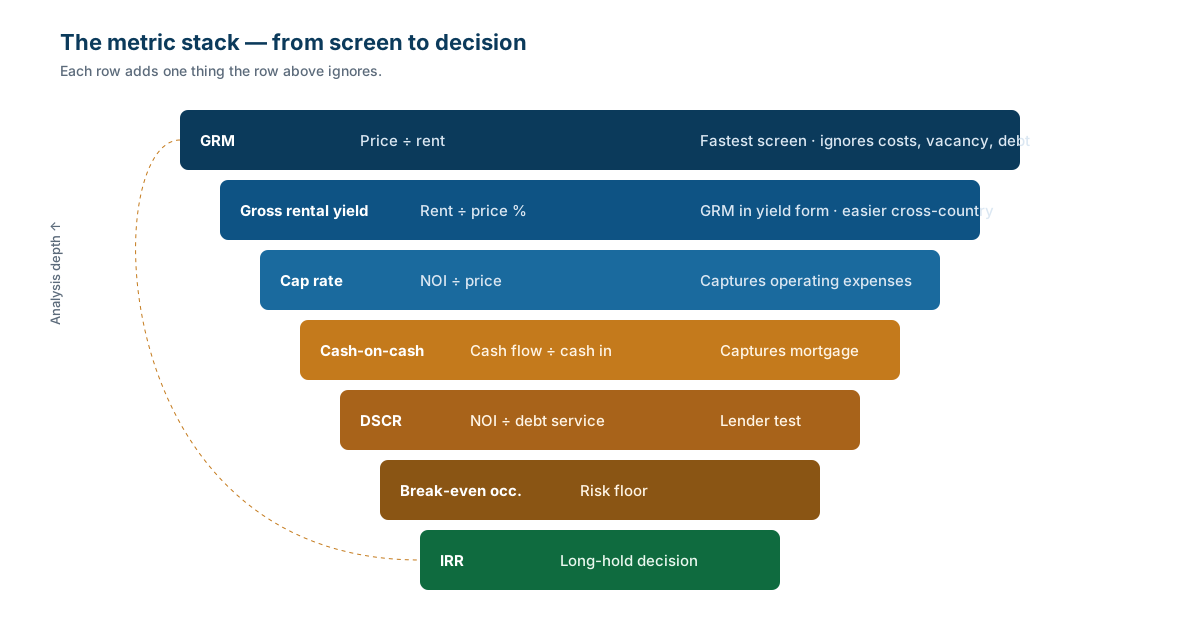
For deep dives on each of these, see our companion guides oncap rate for investors,cap rate vs cash flow,cash-on-cash return,DSCR for investors and break-even occupancy for landlords.
Where each metric belongs in your workflow
Think of the metrics not as competing options but as different lenses applied at different stages of the deal cycle:
- Discovery (0–5 seconds per listing): GRM and gross yield. Reject 80% of listings here.
- Shortlisting (5–10 minutes per listing): Cap rate, effective GRM, and a rough operating expense ratio.
- Underwriting (1–2 hours per listing): Cash-on-cash, DSCR, break-even occupancy, sensitivity to rent and interest-rate stress.
- Committee/decision (half a day): Full IRR model with sale assumption, downside case, and comparison to alternative uses of capital.
Investors get into trouble when they use a discovery-stage metric to make a decision-stage judgement. Buying on GRM is exactly that mistake.
How GRM interacts with leverage
Because GRM is unlevered, it does not move with your loan-to-value ratio. But the acceptable GRM ceiling absolutely does. A cash buyer might tolerate a GRM of 20 in a growth market, because there is no debt service to cover. A 75% LTV investor in the same market cannot — the debt service exceeds the net rent. Publish, for yourself, a table of maximum GRM by leverage level and interest rate. Update it whenever central-bank policy shifts. In 2026 many disciplined investors have quietly lowered their maximum acceptable GRM by 15–25% versus the 2021 environment, without changing anything else about their strategy.
Run your numbers with free calculators
Doing this arithmetic by hand once is educational. Doing it 40 times a week is a job for a calculator. LashkariProperties keeps a free, no-sign-up suite of property tools designed to be used in exactly the sequence this article recommends:
- Screen with GRM.Use the Gross Rent Multiplier calculator to sort listings in seconds. Save your submarket benchmark alongside each deal.
- Confirm the yield. Move promising listings into the rental yield calculator to compute both gross and net yield with your local expense ratios.
- Stress-test the return. Finish with the cap rate calculator to compare unlevered returns across candidate properties and against your target IRR.
If you want to go further, the full calculator library also covers DSCR, cash-on-cash, mortgage affordability, break-even occupancy and stamp duty across Tier-1 markets.
Suggested workflow
Screen 100 listings in the GRM tool. Take the top 20 into rental yield. Run the top 5 through cap rate. Underwrite only the final 2–3 with full DSCR and cash-on-cash. This funnel converts research time into real deals without burning weekends.
The 6-point GRM-plus checklist
Before you promote a GRM screen to a real underwriting model, run each listing through this six-point audit. If any answer is "no" or "unknown", pause.
- Is the price realistic?Confirm expected purchase price using three sold comparables from the last six months.
- Is the rent realistic?Confirm gross rent using three active listings of similar spec within 1 km.
- Is the GRM inside the submarket band?Compare to your own table of submarket GRMs, not a national average.
- Is the operating expense ratio typical?Estimate OER from tax, insurance, management, vacancy, capex. If OER > 45%, GRM overstates return.
- Does the cap rate agree with GRM?Run cap rate. If GRM says cheap and cap rate says expensive, expenses are the problem.
- Does DSCR clear 1.25 at current rates?No lender will finance below this. If DSCR fails, either the price or the rent is wrong.
Rule of thumb
If GRM screens the deal in, cap rate confirms it, DSCR passes at current mortgage rates, and cash-on-cash beats your target, then — and only then — is GRM's job done.
Frequently asked questions
There is no universal number, but in Tier-1 markets a GRM between 8 and 12 is often considered attractive for cash-flow investors, 12–16 is normal for stable metros, and above 20 usually signals a growth or prestige market where cash flow will be thin. Compare only within the same submarket.
No. A very low GRM often reflects higher operating costs, weaker tenant demand, deferred maintenance or higher vacancy risk. Always confirm the reason for the low number before treating it as a bargain.
What is the difference between GRM and cap rate?
GRM uses gross rent and ignores expenses, so it is quick but crude. Cap rate uses net operating income, which reflects real costs like taxes, insurance and management. Use GRM for a 10-second screen and cap rate for a genuine yield comparison.
How do I convert GRM to gross rental yield?
Divide 1 by the GRM and express as a percentage. A GRM of 10 equals a 10% gross yield; a GRM of 20 equals a 5% gross yield. This makes GRM and yield mathematically identical — just quoted differently.
The standard formula uses annual rent. Some US markets quote a monthly GRM based on monthly rent — always confirm which convention you are using so numbers stay comparable across listings.
No. GRM assumes 100% occupancy at market rent. A more realistic screening variant is to use effective gross income, which reduces gross rent by an assumed vacancy rate of 5–10% depending on the local market.
It can, but it is far less reliable. Commercial leases have different structures (triple-net, gross, modified gross) that change how much of gross rent actually reaches the owner. Use cap rate or DSCR instead for commercial deals.
How is GRM used in the UK, Australia and UAE?
Outside the USA, investors more often quote gross rental yield — the inverse of GRM. In the UAE, gross yields of 6–8% are common in Dubai; in London and Sydney, yields of 2.5–4% (GRM 25–40) are typical, reflecting capital-growth-led markets.
Does GRM work for short-term rentals or Airbnb?
GRM is unreliable for short-term rentals because occupancy, cleaning fees and seasonality dominate returns. Use ADR (average daily rate), occupancy rate and RevPAR (revenue per available room) instead of a rent multiplier.
After GRM passes the screen, run gross rental yield, cap rate, cash-on-cash return, DSCR, and break-even occupancy. Only then compare against your required return and financing constraints.
GRM itself is not — it uses price and rent only. But mortgage rates change the acceptable GRM: when borrowing costs rise, investors demand lower GRMs (higher yields) to make deals viable, which is why acceptable GRMs shifted downward globally between 2022 and 2026.
Only after you verify both inputs. Listings sometimes use pro-forma or peak-season rent, or a discounted list price. Recalculate GRM using conservative rent estimates and the price you actually expect to pay at close.
Conclusion and next steps
The Gross Rent Multiplier is neither a genius shortcut nor an investor trap. It is a spellchecker. Used at the top of the funnel, it saves hours of unnecessary underwriting. Used in the middle or end of the funnel, it produces confident, wrong answers.
The disciplined investor treats GRM as the entry ticket to a stack — screen with GRM, confirm with yield, compare with cap rate, finance with DSCR, decide with cash-on-cash and IRR. Any single-metric decision, on any property, in any market, is a decision made with one eye closed.
Your next three actions:
- Build your own submarket GRM benchmarks. Fifteen minutes with a spreadsheet is more valuable than any national average.
- Run every listing on your shortlist through the GRM calculator, then promote survivors to the rental yield and cap rate tools.
- Read the companion pieces oncap rate and DSCRto complete your metric stack.
The overarching principle is simple. Every metric in real estate answers exactly one question. GRM answers "is this listing worth another five minutes of my time?". That is a valuable question — but it is not "should I buy this property?". Treat GRM with the seriousness of a first-line filter and the humility of a metric that ignores four-fifths of what determines a return, and you will be ahead of the vast majority of investors who either dismiss it or worship it.
Every experienced investor has, at some point, either lost money by buying on a low GRM without checking expenses, or missed a great deal by rejecting a high GRM without checking the growth thesis. The goal of this article is not to make you use GRM more, or less — it is to make you use it consciously, knowing exactly what it captures and what it hides, and always as part of a stack that eventually converges on a decision you can defend to a lender, a partner, or your future self.
A short reference protocol
If you take a single practical routine from this guide, take this one. When a listing lands in front of you, walk through it in this exact order, in under two minutes:
- Compute the GRM at expected close price and market-median rent.
- Compare it to your submarket band. Reject if it is more than 15% above the top of the band without a specific, defensible reason.
- Sanity-check the inputs. Is the seller quoting pro-forma rent? Is the list price plausible against sold comparables? If either fails, recalculate.
- Promote survivors to yield, cap rate, and DSCR.Underwrite only the top three of every ten survivors.
- Log the outcome — accepted, promoted, rejected, and why — in a single row of your deal spreadsheet.
Do this consistently for ninety days and you will build the two things most investors never possess: a personal, up-to-the-week benchmark of what your market considers acceptable, and the discipline to walk away from a listing the moment the numbers say you should. In an industry where most decisions are still made on emotion and anecdote, that is a genuine, durable edge.
One final honest observation about GRM
GRM will not survive the next decade unchanged. As data pipelines get better and free calculators surface cap rate, cash-on-cash, and DSCR as fast as GRM once did, the multiplier's information advantage narrows every year. Rising interest rates, tighter lending, and increased regulatory friction around short-term rentals all mean investors need to reach further into the metric stack to underwrite responsibly. The 10-second smell test still has enormous value, but it is no longer sufficient on its own. Investors who pair a fast GRM screen with a disciplined follow-up on cap rate, DSCR, and a stress-tested cash-on-cash calculation are the ones who will still be buying when the cycle turns — while the GRM-only crowd is quietly trying to sell.
Screen your next property in 10 seconds
Enter price and monthly rent. Get GRM, gross yield, and a comparison to submarket benchmarks — no sign-up.
Open the GRM Calculator →
Educational content only. This article does not provide personalised financial, tax or legal advice. Property investment involves risk, including loss of capital. Consult a qualified professional in your jurisdiction before acting on any of the concepts above.
Related guides
- Cap Rate Explained for Property Investors
- Cap Rate vs Cash Flow: Which Metric Should Guide Your Decision?
- Cash-on-Cash Return: How to Calculate It Properly
- DSCR Explained: The Investor Loan Metric That Matters
- Break-Even Occupancy: The Number Every Landlord Needs
Sources
Related reading
Continue reading: Break-Even Occupancy for Landlords · How to Calculate Rental Yield (2026) · Cap Rate Explained for Investors. Run your own numbers with the Gross Rent Multiplier Calculator — it takes under a minute and beats guessing.
Frequently asked questions
What is the gross rent multiplier?
GRM is the number of years of gross rental income a property would take to pay for itself, ignoring every cost of ownership: price divided by annual rent. It needs only two numbers from any listing, which makes it a fast triage tool.
How is GRM calculated?
Divide the asking price by the annual gross rent. A property at $360,000 renting for $2,500 a month has a GRM of 12 (360,000 / 30,000). Lower is generally cheaper relative to income.
What is a good GRM?
There is no universal target — good values differ by market, property type, and interest rates. GRM ignores taxes, insurance, vacancy, and financing, so use it to shortlist properties and then run net yield and cash flow before deciding.
What is a good gross rent multiplier?
In most markets a GRM between 8 and 12 is considered reasonable, with lower numbers meaning a cheaper property relative to rent. In high-cost cities like London or San Francisco, GRMs of 20 to 30 are common because appreciation, not rent, carries the investment case. The GRM is a screening tool only — it ignores vacancies, expenses, and financing, so always pair it with the cap rate and cash-flow analysis before committing.