 By Nirmal Lashkari · Founder · Indore, Madhya Pradesh, India
$400,000 property price and $2,200 monthly rent, the gross rent multiplier is 15.15, based on $26,400 in annual gross rent. This ratio compares purchase price with annual gross rent and is shown to two decimal places.
Gross rent multiplier: 15.15

Gross rent multiplier, usually shortened to GRM, is a compact comparison between a property's price and its gross rental income. This calculator uses two visible inputs: Property price and Monthly rent. It converts the monthly figure into Annual gross rent, then divides price by that annual amount. The result is a multiplier rather than a percentage. A GRM of 12.50 means the price is 12.5 times one year's gross scheduled rent.
GRM is deliberately narrow. It looks at top-line rent before operating expenses, financing, taxes, insurance, vacancy, repairs, management, and capital projects. That makes it useful for a first-pass screen, not a complete return analysis. A lower result generally means more price is supported by each dollar of gross rent, but the calculator's own hint is appropriately cautious: lower generally means better value, not automatically better investment.
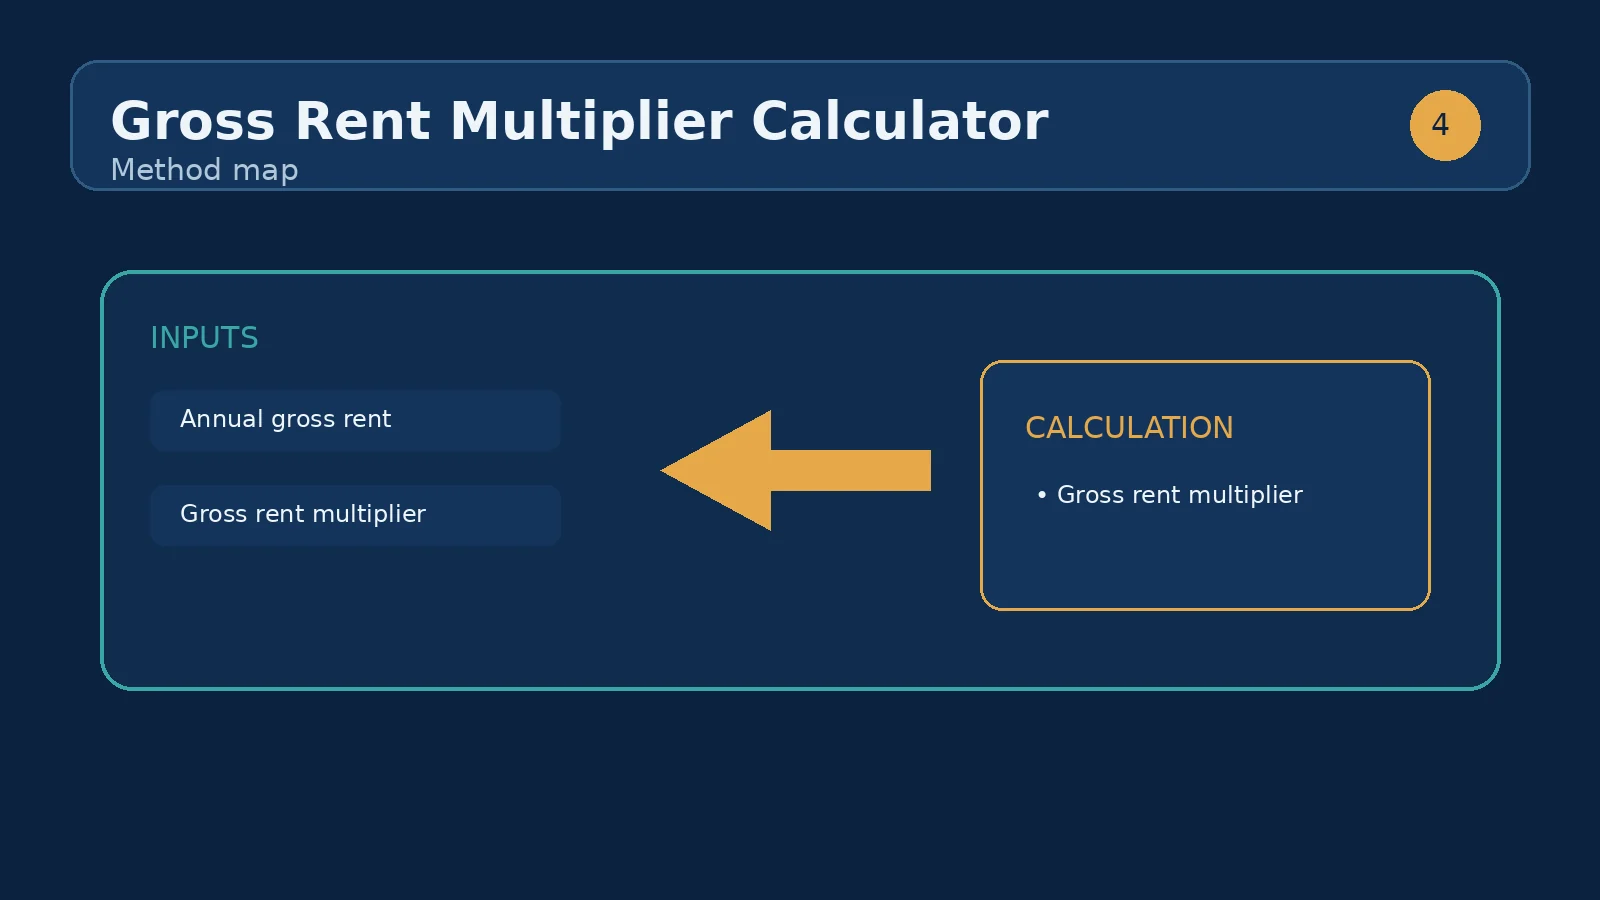
The calculation has two steps. First, annual gross rent equals Monthly rent multiplied by 12. Second, gross rent multiplier equals Property price divided by Annual gross rent. With a property price of $400,000 and monthly rent of $2,200, annual gross rent is $26,400 and GRM is 15.15 when rounded to two decimal places. The output therefore gives a consistent way to compare asking prices against stated rent.
Because the component accepts nonnegative dollar inputs, enter the property's purchase or asking price as a dollar amount and the recurring monthly rent as a dollar amount. Do not enter annual rent in the Monthly rent field, and do not enter a decimal ratio such as 0.15. The component recalculates as values change, formats the multiplier to two decimal places, and formats annual gross rent as currency.
Property price is the numerator of the comparison. For an acquisition screen, it can represent the asking price or a proposed purchase price, but the interpretation should stay consistent across the properties being compared. If one comparison uses list price and another uses a negotiated price, the resulting GRMs answer different questions. Recording the price assumption beside the result prevents a seemingly precise comparison from hiding inconsistent inputs.
Monthly rent is the gross recurring rent used to annualize the income. Use the rent assumption that belongs to the property and comparison period. If a building has multiple units, the field should reflect the combined monthly gross rent you intend to compare with the total property price. The component does not separately model units, other income, vacancy, concessions, or rent growth, so those items should not be silently mixed into this single field.
Suppose Property A is priced at $300,000 and has monthly rent of $2,000. Annual gross rent is $24,000, and GRM is 12.50. Property B is priced at $420,000 with monthly rent of $2,800. Annual gross rent is $33,600, and GRM is also 12.50. The equal result says that, on the supplied gross-rent assumptions, both prices are the same multiple of annual rent.
Now change Property B's monthly rent assumption to $2,400 while leaving price unchanged. Annual gross rent becomes $28,800 and GRM becomes 14.58. The higher multiplier signals that more price is being paid for each dollar of stated gross rent. It does not prove that Property A is superior: expenses, condition, location, lease quality, and financing could reverse the economic conclusion. It does show exactly why rent evidence deserves a sensitivity check before a price decision.
Gross rent multiplier is best read as a relative screening metric. Compare properties with similar use, geography, unit mix, and rent definitions when possible. A result of 10.00 is not a universal pass line, and a result of 20.00 is not a universal rejection line. The useful question is whether the subject property's multiplier is attractive relative to credible nearby or otherwise comparable opportunities measured with the same method.
Annual gross rent is the supporting output that makes the multiplier auditable. If the annual figure is not what you expected, check whether the monthly rent was entered correctly and whether the field should contain combined rent. If annual rent rises while price stays fixed, GRM falls. If price rises while rent stays fixed, GRM rises. These directional relationships are simple, but they make the output easier to sanity-check before using it in a spreadsheet or conversation.
GRM differs from a capitalization rate. A capitalization rate typically relates net operating income to value, while this calculator uses gross rent and does not subtract expenses. GRM also differs from cash-on-cash return, which depends on cash invested and financing, and from internal rate of return, which incorporates the timing of cash flows. Treating these measures as interchangeable can make a gross screen look more complete than it is.
A practical comparison sequence is to use GRM for a quick price-to-rent screen, then move to a net operating income or cap-rate analysis when operating expenses are available. After that, financing assumptions can be tested with a cash-flow or mortgage tool. The sibling use case is the rental property calculator: after this screen identifies a candidate, use that tool to examine income and expenses in a broader property-level estimate rather than stretching GRM beyond its inputs.
The most common mistake is entering annual rent into Monthly rent. That multiplies annual rent by 12 again and produces an artificially small GRM. Another is using a property's gross rent for one unit against the price of the entire building, or using a promised future rent without labeling it as an assumption. A third is comparing a price that includes different inclusions, renovation scopes, or transaction assumptions while treating the multipliers as directly equivalent.
A disciplined review starts by writing down the price basis and the monthly rent basis. Confirm that both describe the same property and time frame. Recalculate with a lower rent assumption if the quoted figure depends on a lease-up or an unverified increase. Then compare the result with similarly calculated properties and proceed to expense-based analysis. The calculator does not validate market rent, inspect a lease, estimate costs, or guarantee an investment outcome; those are separate review tasks.
GRM is sensitive to both inputs, so small assumption changes can matter. For the $400,000 example, monthly rent of $2,000 produces annual gross rent of $24,000 and GRM of 16.67. At $2,200, the result is 15.15. At $2,400, annual gross rent is $28,800 and GRM is 13.89. The price is unchanged in all three cases; only the rent assumption moves. This is a useful way to show how dependent the screen is on the quality of the rent evidence.
Once the output is recorded, choose the next tool according to the question still unanswered. If the question is whether expenses change the apparent value, use a rental-property or cap-rate analysis. If the question is whether debt service fits the plan, use a mortgage or investment cash-flow calculator. If the question is simply whether another listing compares fairly, return here and enter its price and monthly rent with the same definitions. GRM is most useful when it leads to a more complete, explicitly labeled analysis.
Generally yes — a lower multiplier means you pay less per unit of rent. But GRM ignores expenses, so follow up with cap rate and cash flow analysis.
Divide the property price by annual gross rent. On the defaults, $400,000 and $2,200 a month gives $26,400 of annual rent and a GRM of 15.15.
It depends on the market. In areas where yields are low and prices high, a GRM of 25 or more can be normal; in higher-yield markets, 15 or less may be expected. Always benchmark against similar local properties.
No. GRM ignores vacancies, expenses, and financing entirely, so two properties with the same GRM can produce very different cash flow. Use it only as a first-pass screen and confirm with cap rate.
GRM is price divided by annual rent, while cap rate is roughly annual net operating income divided by price. GRM stops at gross rent; cap rate goes further by incorporating operating income and expenses.
The calculator annualizes Monthly rent by multiplying it by 12, then divides Property price by that Annual gross rent. The displayed GRM is formatted to two decimal places.
Annual gross rent is the intermediate output used by the formula and provides a check that the monthly rent input was entered in the intended units.
No. The visible calculation uses property price and gross rent only. It does not subtract vacancy, repairs, management, taxes, insurance, financing, or other operating costs.
No. The component notes that lower generally means better value, but GRM is only a gross-rent comparison and should be considered alongside property quality, expenses, rent support, and other analysis.
Yes, if Property price is the comparable total price and Monthly rent is the combined monthly gross rent for the same property. Keep the definitions consistent across comparisons.
A zero-rent assumption cannot support a meaningful price-to-annual-rent comparison. Use a positive, defensible monthly rent assumption before interpreting the multiplier.
Use the result as a screening point, then examine operating expenses and financing with a broader rental-property, cap-rate, cash-flow, or mortgage calculator as appropriate.
Gross rent multiplier (GRM) explained: how to calculate it, what a good GRM looks like, and its limits as a quick-screen tool.
How we calculate: calcGrm in calculators.ts; regression checks in calculators.test.ts
Last reviewed: . Learn more about Nirmal Lashkari and LashkariProperties.
Disclaimer: This calculator provides estimates for informational purposes only and is not financial, tax, or legal advice. Verify figures with a qualified professional before making decisions.
