 By Nirmal Lashkari · Founder · Indore, Madhya Pradesh, India
$400,000 property price and $2,000 comparable monthly rent produce a 16.7 price-to-rent ratio and $24,000 in annual rent. The ratio compares the purchase price with one year of rent; values below 15 typically favor buying, while values above 20 typically favor renting.
Rent for a similar property in the same area.
Interpretation
neutral
Price-to-rent ratio: 16.7
Below 15 typically favors buying, above 20 typically favors renting.

The price-to-rent ratio compares a property's purchase price with the rent a similar property could command over one year. This calculator asks for only two values: Property price and Comparable monthly rent. It multiplies the monthly rent by 12 to produce Annual rent, then divides price by annual rent to produce the Price-to-rent ratio. The result is a screening measure, not a complete buy-versus-rent verdict.
For example, a property price of $400,000 and comparable monthly rent of $2,000 produce annual rent of $24,000 and a ratio of 16.7. In plain language, the price is 16.7 times one year's comparable rent. The calculator also labels the result with an interpretation. Its visible guidepost says that a result below 15 typically favors buying, while a result above 20 typically favors renting; the middle range calls for closer examination rather than an automatic answer.
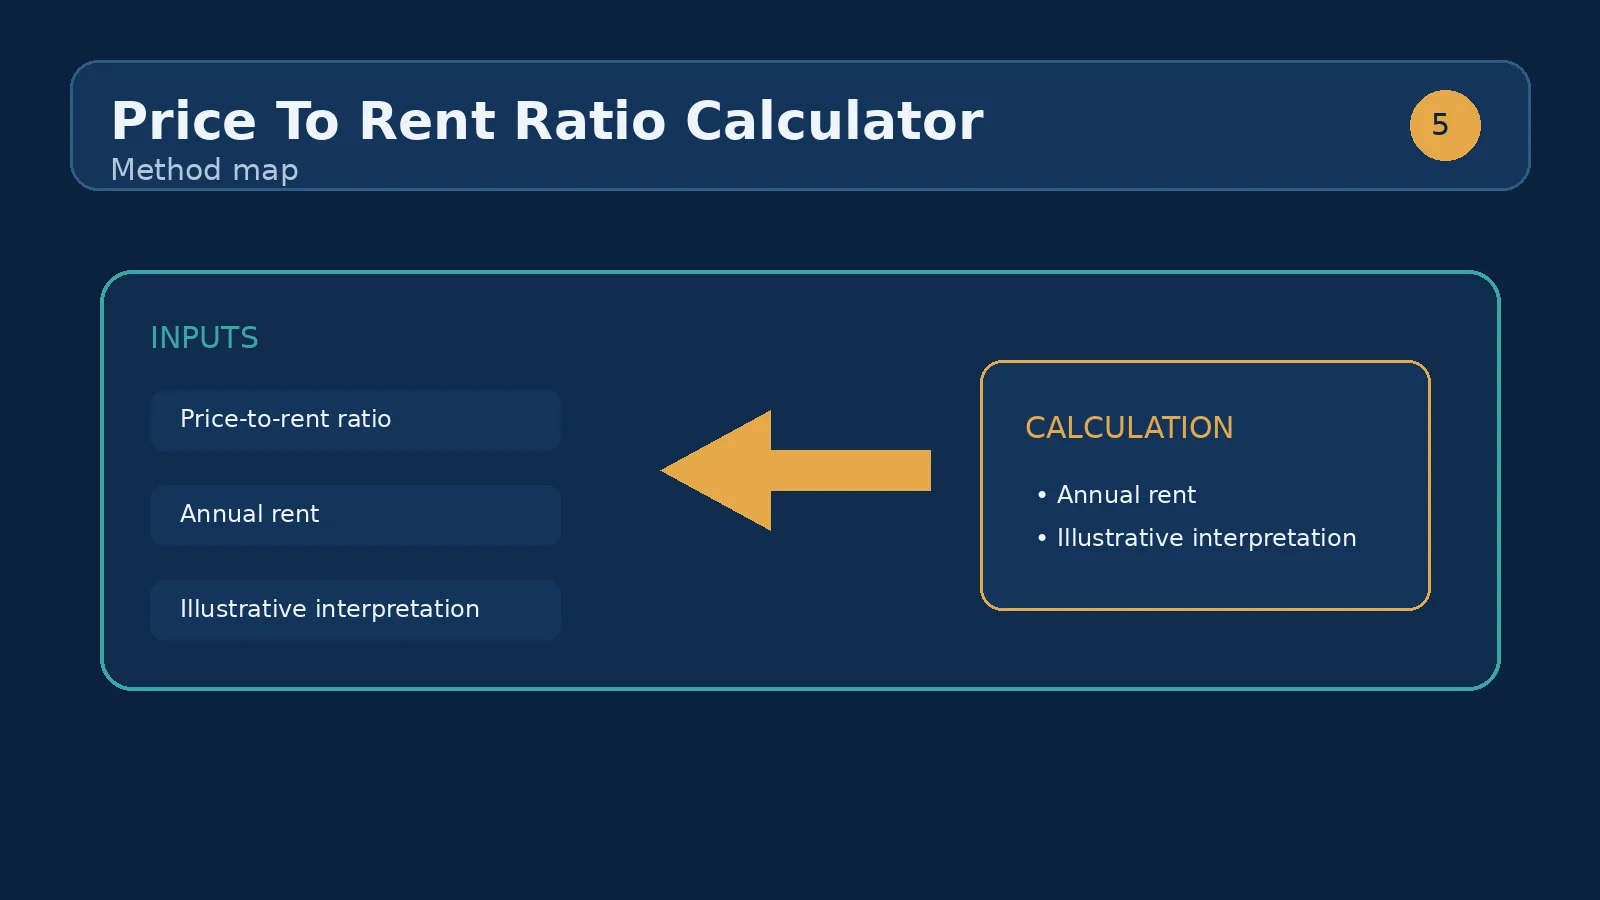
The calculation is deliberately compact. Annual rent equals comparable monthly rent multiplied by 12. Price-to-rent ratio equals property price divided by annual rent. If the rent field is $2,000, annual rent is $24,000; dividing a $400,000 price by $24,000 gives 16.6667, displayed as 16.7 because the result is formatted to one decimal place. Currency output is shown separately for annual rent.
The two inputs must describe the same type of property and the same market context. Property price is the purchase amount you want to test. Comparable monthly rent is the rent for a similar property in the same area, matching meaningful features such as size, condition, bedrooms, parking, and location. The rent hint in the component is important: a random listing, a whole-home rent compared with a room, or a furnished premium compared with an unfurnished sale can distort the ratio before the arithmetic even begins.
A lower ratio means the purchase price is smaller relative to the annual rent benchmark. A higher ratio means the price is larger relative to that benchmark. The component presents an interpretation alongside the numeric ratio so you can use the thresholds as an initial signal. A ratio of 12.5 sits below 15; a ratio of 22.0 sits above 20; a ratio of 17.0 is between those guideposts and deserves a fuller comparison.
The interpretation does not calculate a mortgage payment, property taxes, insurance, maintenance, vacancy, transaction costs, financing costs, or investment return. It also does not know how long you would stay, whether rent will change, or whether the property has unusual features. Treat the label as a prompt for the next question: does the purchase price make sense relative to a well-supported rent estimate, after the costs and flexibility of each option are considered?
Suppose a comparable home rents for $2,000 per month and the property under review costs $400,000. Enter 400000 in Property price and 2000 in Comparable monthly rent. The calculator returns Annual rent of $24,000 and a Price-to-rent ratio of 16.7. The result is not below 15 or above 20, so the threshold note does not settle the decision. It tells you that the comparison belongs in the middle range, where input quality and omitted costs matter greatly.
Now hold the $400,000 price constant and test a better-supported rent estimate of $2,500 per month. Annual rent becomes $30,000 and the ratio becomes 13.3. The ratio moves materially even though the property's price has not changed. That change demonstrates why comparable-rent research is not a minor detail. Before using the new result, confirm that $2,500 describes a genuinely similar property rather than a larger, renovated, furnished, or differently located one.
The ratio responds in opposite directions to the two inputs. Raising price while holding rent constant raises the ratio. Raising comparable rent while holding price constant lowers the ratio. The following examples use the same simple formula and show why a small input change can alter the screening category.
At $300,000 and $2,000 monthly rent, annual rent is $24,000 and the ratio is 12.5. At $400,000 and $2,000 rent, the ratio is 16.7. At $500,000 and $2,000 rent, it is 20.8. Alternatively, at $400,000 with $1,600 monthly rent, annual rent is $19,200 and the ratio is 20.8; with $2,400 rent, annual rent is $28,800 and the ratio is 13.9. These are comparisons of the calculator's outputs, not promises about which choice will be financially superior.
The most common mistake is entering asking rent instead of comparable rent. A high or low outlier can move the ratio enough to create a false sense of certainty. Use several relevant observations and choose a defensible monthly figure for the same property type and area. Another mistake is mixing time periods: the component expects monthly rent, so entering an annual rent figure as though it were monthly inflates annual rent twelvefold and collapses the ratio.
Do not compare unlike properties merely because they share a postal area. A small apartment and a large detached home may have very different rent relationships. Do not subtract a deposit, utilities, concessions, or estimated expenses from the rent field; this calculator specifically labels the input Comparable monthly rent and computes gross annual rent. Finally, do not treat the ratio as a yield. Gross annual rent divided by price is the reciprocal relationship, while an actual net yield would require operating costs and other assumptions that this component does not collect.
Start by testing a reasonable range of comparable monthly rent rather than relying on one number. Record the ratio at the low, central, and high rent estimates. Then test plausible purchase prices. If the interpretation changes across that range, the decision is sensitive to valuation or rent evidence and deserves more research. If it remains in the same broad range, the screening signal is more stable, although it is still incomplete.
Next, move from the gross comparison to a full budget. A buyer should separately examine financing, recurring ownership costs, repairs, and purchase or sale expenses. A renter should examine rent changes, deposits, moving costs, and the value of flexibility. The calculator is useful precisely because it isolates one relationship; it should be paired with tools that model the other relationships rather than forced to answer questions it does not contain.
After calculating the ratio, the natural next use case is a mortgage or home-affordability calculator. Carry the $400,000 price into that tool, add the financing assumptions it requests, and compare the resulting ownership payment with the same property's $2,000 comparable monthly rent. The two calculations answer different questions: this page compares price with gross annual rent, while the sibling tool can examine a payment or affordability structure using its own visible inputs.
You can also use an investment-property or rental-yield tool if one is available in the same calculator collection. Carry over the price and rent, but do not assume its output will equal 1 divided by this ratio unless the tools define every input identically. A sibling tool may account for expenses or vacancy, whereas this calculator intentionally reports annual gross rent and a ratio. Keeping those definitions separate makes the comparison more reliable.
Below roughly 15 tends to favor buying, above roughly 20 tends to favor renting. Treat these as guidelines, not rules, and consider local factors.
Divide the property price by its annual rent. On the defaults, $400,000 divided by $2,000 of monthly rent is $16.7, based on $24,000 of annual rent.
When property prices run ahead of what landlords can charge in rent, the ratio climbs. A common trigger is cheap credit inflating prices while rents do not keep pace — the classic signal that a market favors renting over buying.
It averages extremes and ignores financing, taxes, and transaction costs, so it cannot decide for you. Use it as one neighborhood-level signal alongside your own buy-versus-rent calculation.
It suggests strong rental income relative to price, but it can also reflect a market with weak demand. Treat an extreme figure as a prompt to look deeper, not as a verdict.
It means the property price is 16.7 times the comparable property's annual rent using the calculator's inputs. It falls between the component's below-15 and above-20 guideposts, so it is a screening result rather than a decisive label.
The input is comparable monthly rent, while the ratio uses annual rent. Multiplying the monthly figure by 12 converts it to the calculator's annual-rent output.
No. Enter the comparable monthly rent. Entering an annual amount as monthly rent causes the calculator to multiply it by 12 again and produces an incorrect ratio.
No. The component describes a ratio below 15 as typically favoring buying, but it does not model financing, taxes, insurance, maintenance, transaction costs, or your time horizon.
Use rent for a similar property in the same area, with comparable size, condition, features, and leasing terms. A single unlike listing can make the output misleading.
No. The ratio is price divided by gross annual rent. A gross rent-to-price percentage is its reciprocal, while net yield would require additional expense inputs that this calculator does not collect.
Higher comparable monthly rent increases annual rent and lowers the ratio; lower rent does the opposite. Because the interpretation uses ratio guideposts, that movement can change the displayed label.
Price-to-rent ratio explained: what a high or low ratio signals about a market, and how to use it in a rent-vs-buy decision.
How we calculate: calcPriceToRent in calculators.ts; regression checks in calculators.test.ts
Last reviewed: . Learn more about Nirmal Lashkari and LashkariProperties.
Disclaimer: This calculator provides estimates for informational purposes only and is not financial, tax, or legal advice. Verify figures with a qualified professional before making decisions.
