
Investment Guides
Cash-on-Cash Return: How to Calculate It Properly
By Aditi Lashkari · August 6, 2026 · 33 min read

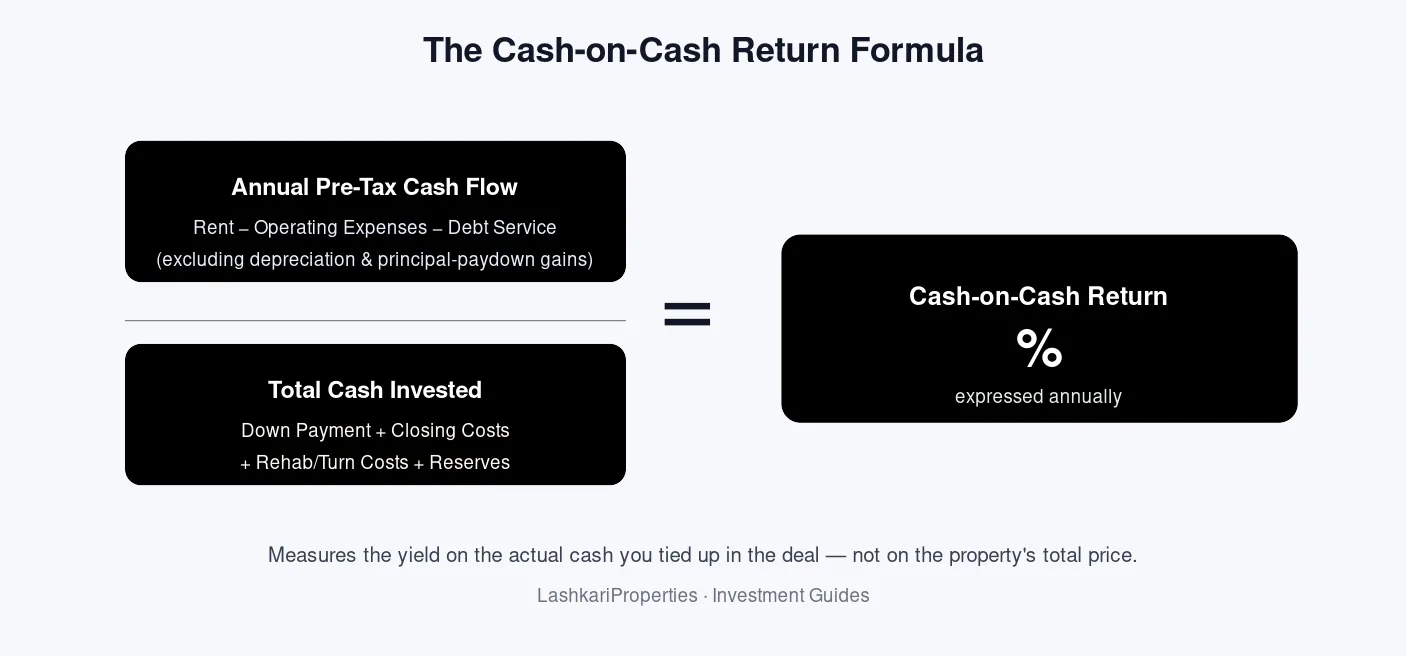
Cash-on-cash returnis the most misunderstood number in property investing — and one of the most useful once you calculate it properly. It answers a deceptively simple question:for every dollar, pound, or dirham I actually put into this deal, how much pre-tax cash does it hand back to me each year?That is a very different question from “what will this property be worth in ten years,” and it is exactly the question that keeps investors solvent when markets get bumpy.
Yet the metric is quietly abused in listings, pitch decks and “deal calculators” all over the internet. Some analyses exclude closing costs. Others sneak principal pay-down into the numerator to make the yield look bigger. Others compare cash-on-cash across deals with wildly different leverage and pretend it is apples-to-apples. Each of these mistakes can turn a break-even rental into what looks like a home-run investment on a spreadsheet.
By the end of this guide you will be able to: define cash-on-cash return precisely; calculate it from scratch for both all-cash and leveraged deals; recognise the classic mistakes that inflate it; place it correctly inside the wider metric family of cap rate, DSCR and IRR; and verify your work in seconds using LashkariProperties’ freeROI calculatorandcash flow calculator. We use Tier-1 market context (USA, UK, Canada, Australia, UAE) throughout, but the mathematics is universal.
A quick note on why this matters more in 2026 than it did five years ago. Two structural shifts have made cash-on-cash return the single most important number on many investor dashboards. First, financing costs have re-based: mortgage rates across Tier-1 markets have spent much of the last three years in a range that would have looked normal in the early 2000s but was unfamiliar to anyone whose investing career began after 2010. That change flipped many deals from positive to negative leverage overnight. Second, rent growth has cooled off the double-digit spikes of the immediate post-pandemic years and returned to something closer to long-term trend. In that environment, buying for “capital growth alone” and ignoring day-one cash yield has become genuinely dangerous — a deal that does not cover its own costs today needs either a lot of reserves or a lot of luck to survive to the exit.
The other reason to prioritise cash-on-cash return: it is the only investor metric that lines up cleanly with the way a lender, an accountant and a spouse all think about the deal at the same time. A lender wants to know the property will service its debt (DSCR). An accountant wants to know what taxable income you are creating (a separate calculation). Your spouse wants to know whether this deal will drain the joint account every month or top it up. Cash-on-cash return is the only ratio that ties all three perspectives to the same denominator — the actual cash you handed over at close.
This article is educational. It is not personalised financial, tax, mortgage or legal advice. Property rules — tax, lending, tenancy, stamp duty and transfer taxes — vary sharply by country, state and city. Always verify your assumptions with a licensed local professional before acting.
Key definitions and the cash-on-cash return formula
Cash-on-cash return (sometimes abbreviatedCoC, occasionally called theequity dividend rate) is a real-estate cash yield: annual pre-tax cash flow divided by the total cash the investor has actually committed to the deal. It is deliberately narrow. It ignores appreciation, principal amortisation, depreciation and tax shields. It only asks how hard yourinvested cashis workingthis year.
The numerator: annual pre-tax cash flow
Annual pre-tax cash flow is what lands in the bank account after every recurring operating obligation is paid, including the mortgage — but before income tax. In practice:
Operating expenses include property management, repairs and maintenance reserves, insurance, property taxes or council rates, HOA/strata fees, utilities you pay on behalf of the tenant, leasing costs, licensing and any recurring compliance costs. It doesnotinclude capital expenditures (roof replacements, new HVAC), depreciation or your personal income tax.
The denominator: total cash invested
Total cash invested is every dollar you actually parted with to open the deal. Miss any one of these and your cash-on-cash return will be optimistically wrong.
- Down payment— typically 20%–25% for investment property in the USA/UK/Canada/Australia, sometimes higher in the UAE for non-resident buyers.
- Closing costs— lender fees, appraisal, survey, legal, title insurance, transfer taxes and stamp duty. In some Tier-1 markets these can be 3%–8% of the price.
- Initial rehab / make-ready— everything you spent to make the unit rentable at your projected rent.
- Reserves funded at close— many lenders require 3–6 months of PITI; even without a requirement, prudent investors fund a repair and vacancy reserve.
If a cash you would refuse to write off in a bad year, it belongs in the denominator. That includes non-refundable deposits and lender-required escrows, but usually excludes recoverable security deposits held on behalf of tenants.
Units, timeframes and sign conventions
Cash-on-cash return is always expressed as a percentage over a single year. Investors normally quoteyear-one stabilisedcash-on-cash — that is, the projected annual figure after any lease-up or rehab period. A five-year average cash-on-cash is a distinct (and more forgiving) statistic and should be labelled as such.
Cash-on-cash return in plain English
Here is the plain-English version we teach first-time investors to say out loud: “Of the money I actually wrote a cheque for at closing, how many cents do I get back in usable cash every year?” If the answer is seven cents on the dollar, that is a 7% cash-on-cash return. If it is one cent, that is 1%. If it is negative, you are paying the property to exist. Once you can phrase the question in that everyday way, the formula stops feeling abstract — it is simply the ratio of “cash the property pays me this year” to “cash I locked up to own it.”
Levered vs unlevered cash-on-cash return
Most professional investors quietly track two versions of the metric.Unlevered(or “unleveraged”) cash-on-cash uses NOI as the numerator and the full purchase-plus-costs figure as the denominator; it strips financing out and tells you how the asset performs on its own merits.Leveredcash-on-cash uses pre-tax cash flow after debt service in the numerator and only the cash you actually invested (down payment + costs + rehab + reserves) as the denominator. Comparing the two side by side shows precisely how much of your return comes from the property and how much comes from the loan structure. When the two are close, financing is neutral. When the levered figure is far above the unlevered, you are riding positive leverage; when it is well below, negative leverage is quietly eating your return.
Why cash-on-cash return matters for buyers, investors and landlords
Cash-on-cash return is the metric that decides whether your rental portfolio quietly compounds — or quietly bleeds. It answers three practical questions:
- “Will this deal feed itself?”A property with a positive cash-on-cash return covers its own costs and puts money back in your pocket every year. A negative one requires you to feed it from your salary or savings.
- “Am I earning enough on my equity to justify the risk?”Cash locked in a rental cannot buy an index fund, a bond ladder or another property. Cash-on-cash lets you compare like-for-like against the alternatives.
- “How much of this return is really the property, and how much is the loan?”Split the calculation into leveraged and unleveraged versions and you will see exactly where the return is coming from.
If you cannot state the cash-on-cash return of every property you own, you do not really own an investment — you own a hope.
Where cash-on-cash fits into your decision stack
Serious operators do not lean on a single number. They look at cap rate to value the asset, DSCR to satisfy the lender, cash-on-cash to size the yield on their equity, and IRR to summarise the entire hold. Cash-on-cash sits at the centre of that stack because it is the only number that answers the question every investor eventually asks:how much cash does this deal actually pay me next year?
Why buyers of primary residences also benefit from understanding it
Cash-on-cash return is often written about as if it only applies to landlords. In practice, first-time buyers evaluating a house-hack (living in one unit of a duplex or triplex, renting the others) or an accessory dwelling unit (ADU) get enormous value from it. A homeowner with a rented basement suite, a rented ADU, or a spare room on a medium-term lease is, mathematically, running a small rental business inside their primary residence. Applying the cash-on-cash discipline — pre-tax rent minus incremental expenses, divided by the extra cash the rental portion required — will often reveal that a modest side-let is subsidising the mortgage by several hundred dollars a month, materially improving the household’s finances in a way that headline mortgage calculators never surface.
Landlords: cash-on-cash return is your early-warning system
For landlords holding one to ten doors, cash-on-cash return functions as an operational early-warning system. Track it monthly (annualising the trailing twelve months) and you will spot creeping expense inflation, a stealthy rise in vacancy, or a property manager quietly slipping in additional fees long before the annual statement forces you to notice. Many of the most experienced landlords we speak to run a simple traffic-light dashboard: green if trailing-twelve-month cash-on-cash is within one percentage point of budget, amber if it is one to two points below, red if it is more than two points below. That single discipline replaces most of what expensive property-portfolio software promises to do.
Step-by-step: how to calculate cash-on-cash return properly
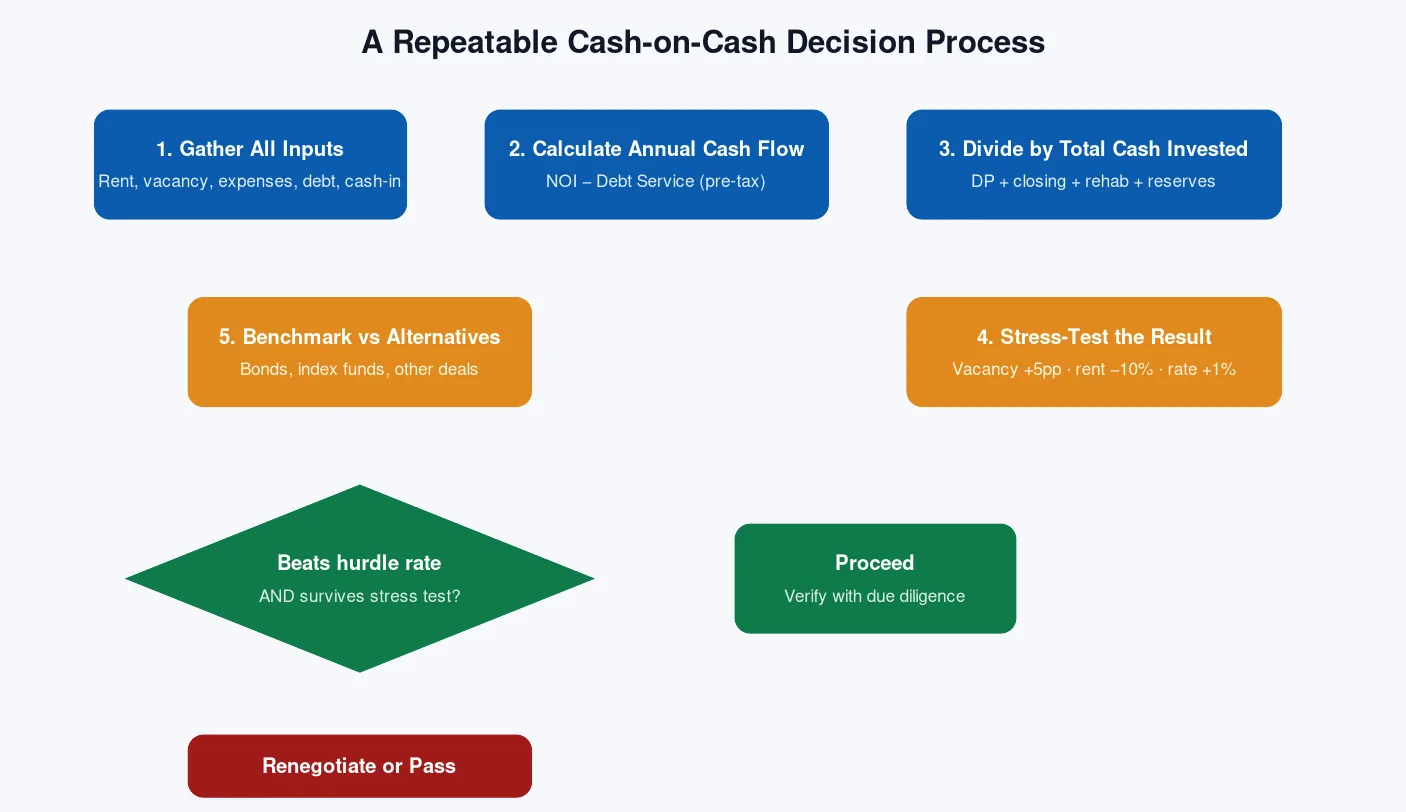
Step 1 — Gather every input, in writing
The biggest single source of error in cash-on-cash calculations is missing data, not bad arithmetic. Before you touch a calculator, list:
- Gross scheduled rent (12 × monthly market rent).
- Vacancy assumption (5%–10% is common in Tier-1 markets; use local data).
- Operating expenses (line-by-line, not a “50% rule” shortcut).
- Loan terms: principal, interest rate, amortisation period, any interest-only period, fees.
- All-in cash to close, including closing costs, rehab and reserves.
Step 2 — Build annual pre-tax cash flow
Work top-down through the income statement. Start with gross rent, subtract vacancy and credit loss to getEffective Gross Income (EGI). Subtract operating expenses to getNet Operating Income (NOI). Then subtract annual debt service (principal + interest paid to the lender over 12 months, but note: onlyinterestis an expense — principal is a balance-sheet item — so when we computecash flowwe subtract the full debt-service payment because that is the cash leaving your bank account).
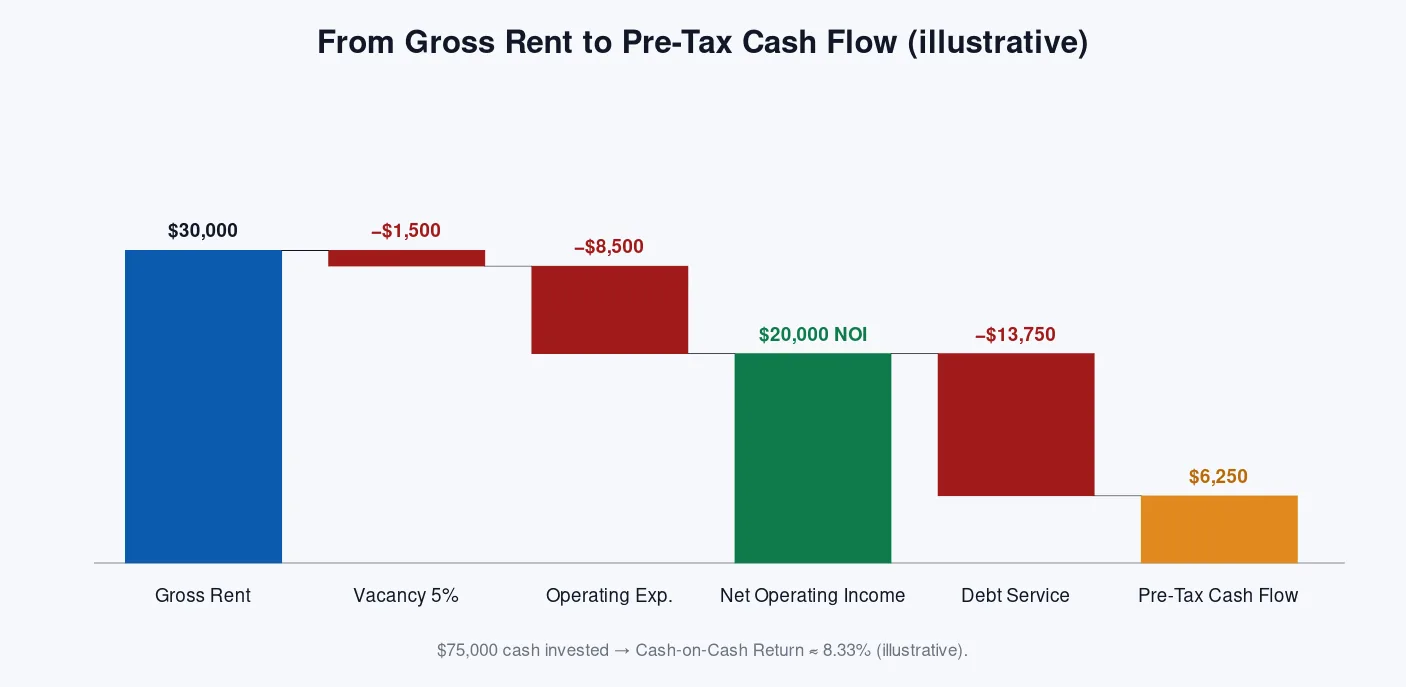
Step 3 — Total your cash invested
Add up the four denominator buckets: down payment, closing costs, initial rehab and reserves. Do not net out an expected refund of appraisal deposit that you have not yet received. Do not exclude a lender-required insurance escrow because “it is still my money” — it is, but it is not producing yield.
Step 4 — Divide and express as a percentage
CoC (%) = (Pre-Tax Cash Flow ÷ Total Cash Invested) × 100
Round to one decimal place for reporting. Save two decimals for internal comparison across similar deals.
Step 5 — Stress test the result
Never publish a single cash-on-cash number for a deal. Publish three: your base case, a mild stress (vacancy +5 percentage points, rent −5%, operating expenses +10%) and a hard stress (rate +150 bps at refinance, vacancy +10 pp). If the hard stress goes negative, the deal only pencils under favourable conditions.
Step 6 — Benchmark against a personal hurdle rate
A calculated cash-on-cash return is meaningless until you compare it against something. Serious investors define a personalhurdle rate— the minimum annual cash yield they require before committing capital — and refuse to cross it. A common way to set the hurdle: take the yield on a government bond you consider genuinely risk-free in your currency (for example the 10-year Treasury for USD investors), add a real-estate risk premium of three to five percentage points to compensate for illiquidity, tenant risk, capex risk and management time, and use that as your floor. If a levered deal cannot beat that floor comfortably, it is not paying you enough for the trouble.
Step 7 — Recalculate with real numbers every 12 months
Year-one cash-on-cash is a projection. Year-two onward, it is a fact. Every twelve months, redo the calculation using actual collected rent (not scheduled), actual paid expenses (including anything you charged to a personal card), and the actual debt service including any escrow shortfalls. Compare the actual to your original underwrite. The variance itself is a powerful diagnostic — chronic under-performance tells you either your underwriting is too optimistic or your operations are leaking money, and both problems get worse the longer you leave them.
Confirm the arithmetic in the free LashkariPropertiesROI calculatorandcash flow calculator. Both are designed to enforce the four-bucket denominator so nothing gets left out.
Worked example 1 — an all-cash purchase
Consider a duplex in a stable US Midwest market priced atUS$300,000. You buy it with cash, spend $6,000 on closing and $4,000 on make-ready, and you fund a $5,000 reserve. Total cash invested is$315,000. Market rent is $1,500 per unit per month.
All-cash duplex — year-one projected numbers
With no financing, pre-tax cash flow equals NOI. Cash-on-cash is:
Because there is no debt in this scenario, this figure is also theunleveraged cash yield. It is close to — but not identical to — the property’s cap rate, which would use market value rather than your all-in cash. The two diverge whenever your total cash invested differs from the price (for example, when you paid a premium at auction, or added significant rehab).
Notice what this example doesnotinclude. It does not include depreciation, because depreciation is a non-cash accounting expense. It does not include principal pay-down, because there is no loan. And it does not include appreciation, because appreciation only becomes cash when you sell or refinance. All three of those are real economic benefits of owning property, and they will show up in your total-return numbers. But cash-on-cash is deliberately blind to them because it is the metric that answers the specific question of “how much cash lands in my account this year.”
An investor who insists on 7.32% year-one cash-on-cash from an all-cash purchase is implicitly saying: “I am willing to hold this asset even if it never appreciates, because the annual cash yield alone beats my hurdle rate.” That is a much more defensive posture than betting on capital growth, and it is the posture that survives downturns most reliably. In late-cycle markets we consistently see the strongest all-cash buyers gravitate toward secondary Midwest US cities, midlands UK towns and secondary Australian regional centres for exactly this reason — the cash yield alone is defensible without needing the market to rise.
Worked example 2 — the same duplex with 75% leverage
Now buy the same $300,000 duplex with a 25% down payment and a 30-year mortgage at 6.75%. Down payment is $75,000, closing costs $6,000, make-ready $4,000, reserves $5,000 — total cash invested$90,000. Annual debt service on $225,000 at 6.75% over 30 years is approximately$17,505.
Leveraged duplex — same property, financed at 75% LTV
Two observations. First, leveragereducedthe cash-on-cash return in this case, from 7.32% to 6.18%, because the loan constant (~7.78%) exceeded the property’s unleveraged yield (~7.32%). This is the phenomenon known asnegative leverage. Second, absolute dollars of cash flow collapsed from $23,064 to $5,559 — the same deal is now far more sensitive to any drop in rent or spike in vacancy.
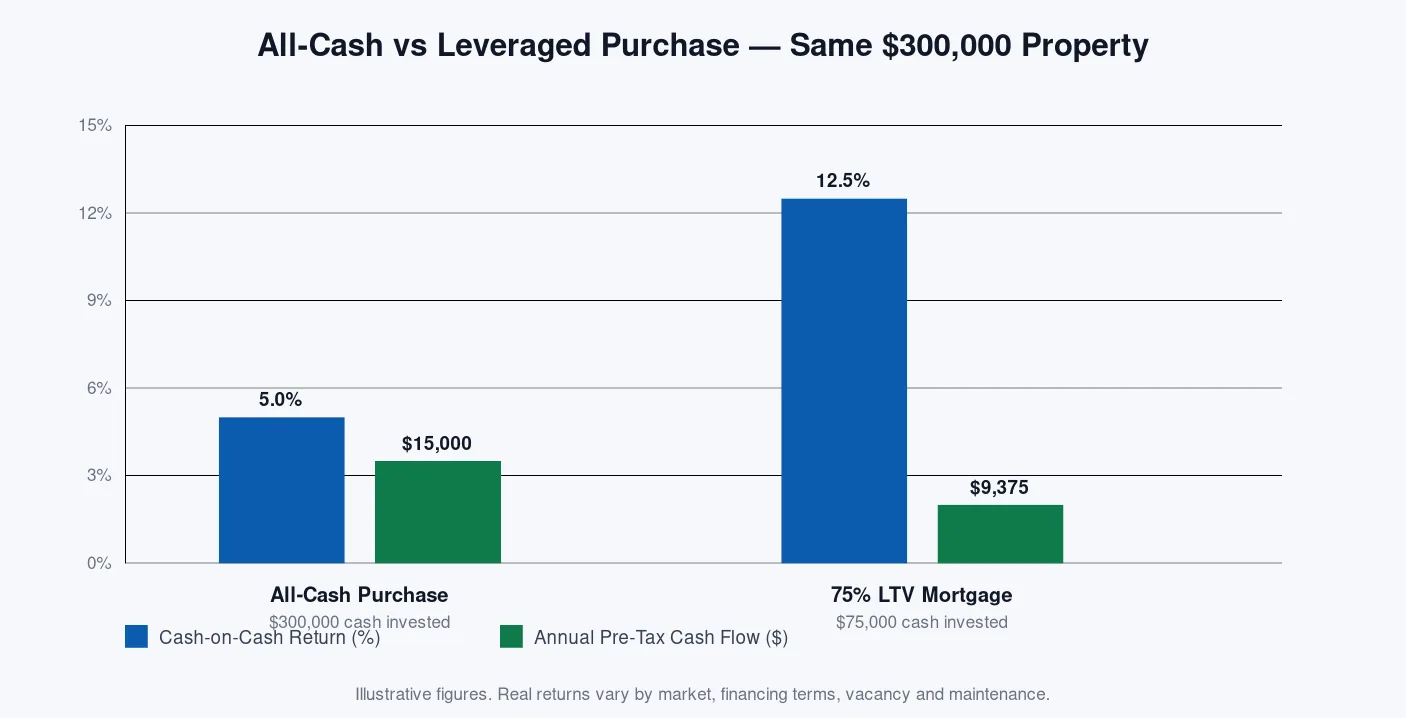
Leverage helps cash-on-cash return only when the unleveraged yield beats the loan constant (annual debt service ÷ loan amount). In late-cycle rate environments, cheap deals can quietly slip into negative leverage even when the “headline” interest rate looks reasonable.
What happens when leverage works in your favour
To see the opposite scenario, imagine the same duplex generating a higher NOI of $30,000 — perhaps because rents have grown, or because you bought below market. The property yields 10% unleveraged on the $300,000 price. Financing 75% at 6.75% still costs a 7.78% loan constant, but now the property yield is safely above it. Pre-tax cash flow becomes $30,000 − $17,505 = $12,495, and on $90,000 of invested cash the cash-on-cash return jumps to 13.9%. This is textbook positive leverage: you are earning the spread between the property’s unleveraged yield and the cost of debt, and applying that spread to a bigger nominal asset than you could have bought with cash.
The important intuition is that positive leverage cuts both ways in dollar terms too. When rents dip or expenses spike, the debt service does not shrink to help you. The 13.9% cash-on-cash you enjoy in a good year can compress to 3% or 4% quickly if EGI drops by even 10%. That is why our stress tests target rent, vacancy and rate simultaneously — not sequentially. A deal that looks great on any one of those axes taken alone can be fragile once you compound them.
Interest-only loans, initial fixed periods and refinance risk
A subtle wrinkle affects UK buy-to-let investors and some US commercial loans: many mortgages are interest-only during a fixed period, then either amortise or require a refinance. During the interest-only window, debt service is smaller and cash-on-cash return looks flattering. When the loan converts, or when a new loan is written at market rates, both the debt service and the loan constant can jump abruptly. Always underwrite thepost-refinancecash-on-cash separately, and treat the interest-only-window figure as a temporary premium, not the base case. If your deal only clears the hurdle rate during the interest-only phase, you have not underwritten it, you have romanced it.
Worked example 3 — a value-add / BRRRR deal
A tired triplex in a UK Midlands town is on the market for£220,000. You pay 25% down (£55,000), stamp duty and legal £11,000, and invest £35,000 in a full refurbishment. Six months into the hold, rents rise from a below-market £16,800 per year to £25,200 after refurbishment. You keep a £6,000 reserve. Total cash invested is£107,000. Annual debt service on the £165,000 mortgage at 5.5% over 25 years is roughly£12,155.
UK triplex value-add — year-one stabilised
Repairs, insurance, management, service charge
4.14% year-one cash-on-cash may look mediocre. The value-add investor’s real payoff comes at refinance: if the refurbished triplex appraises for £280,000 and the investor pulls out £50,000 of tax-deferred equity via a cash-out remortgage, theremainingcash left in the deal drops from £107,000 to £57,000. Recomputed on that new equity base, cash-on-cash (with a slightly higher debt-service load) can jump above 6%. That is why cash-on-cash return should always be labelled with the point in the deal life-cycle it refers to.
The value-add example also illustrates why cash-on-cash return should never be evaluated in isolation from total invested-cash exposure. During refurbishment the property produced zero income for six months. During that period the investor still paid interest, insurance, council tax on the empty property, and refurbishment contractors — real cash burn that does not appear anywhere in the year-one stabilised calculation shown above. A sophisticated investor either capitalises those costs into the denominator (which we recommend), or reports a separateproject-to-datecash-on-cash figure that treats the refurb period honestly. Theinvestment calculatorsupports both conventions; pick one and stay consistent across your deals.
Cash-on-cash return after a cash-out refinance
When investors talk about “infinite” cash-on-cash after a refinance, they are using arithmetic honestly but potentially misleadingly. If the refinance returns 100% of your invested capital, the denominator becomes zero and the ratio becomes mathematically undefined. In practice, treat this as a signal that you have recovered your capital and are now playing with the property’s equity. The right ongoing metric at that point becomes return on equity (ROE) — net cash flow divided by current equity in the property — because that is the capital that could otherwise be freed up and redeployed. Cash-on-cash return should retire from the analysis the moment its denominator hits zero.
Model the refinance year separately. TheLashkariProperties investment calculatorlets you toggle a refinance event and see the effect on cash-on-cash before and after.
Tier-1 market nuances
Cash-on-cash return is universal, but the inputs behave differently across major markets. Below is a high-level orientation — not a forecast — for how to think about each country.
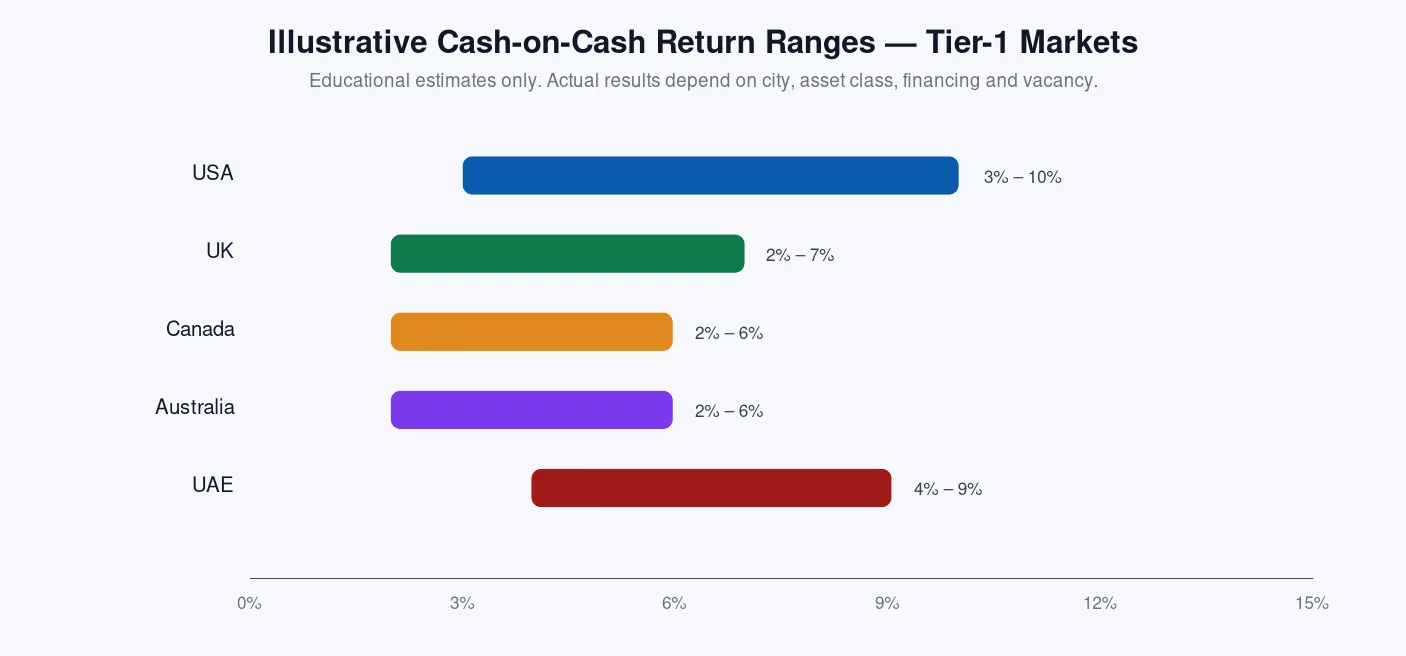
The USA has the widest dispersion of any Tier-1 market. Coastal metros (San Francisco, New York, Seattle) commonly produce 2%–4% cash-on-cash even with financing, while Midwest and Sun-Belt secondary cities can reach 8%–12% on solid stabilised rentals. Property tax varies dramatically by state (Texas and New Jersey are notably high; Hawaii and Alabama are low), and it flows straight through the numerator. Confirm rates against your county assessor and use official data such as theUS Census Bureau housing statisticsandFreddie Mac Primary Mortgage Market Surveywhen checking rates.
Two USA-specific inputs are commonly mis-modelled. First, homeowners association (HOA) dues on condominiums and townhomes are a fixed operating cost that scales with amenity level, not with rent — a $500-per-month HOA on a $1,500-per-month rental is a devastating drag on cash-on-cash return that many investors underestimate. Second, insurance costs have moved sharply higher in states exposed to hurricanes, wildfires and hail (Florida, California, Louisiana, parts of Colorado and Texas); underwrite current-year quotes, not the seller’s legacy premium. Both of these line items can single-handedly turn a projected 8% cash-on-cash into 4%, and both are entirely inside the operating-expense section of the numerator.
UK yields are compressed in London and the South East and higher in the North East, Wales and parts of Scotland. Stamp Duty Land Tax (SDLT) — including the surcharge on additional dwellings — is a material closing cost that should always be included in the denominator. Buy-to-let mortgage rates and stress tests set by theBank of Englandalso move the loan constant meaningfully.
UK investors also need to model the interaction between mortgage interest relief limitations (for non-corporate landlords), higher-rate SDLT surcharges on additional dwellings, and the shift many landlords have made toward holding property through a limited company. Each of those choices flows through cash-on-cash in a different way. Personal-name landlords typically show a higher pre-tax cash-on-cash but a lower after-tax figure because interest is no longer fully deductible against rental income. Limited-company landlords face a higher effective loan constant (buy-to-let corporate rates tend to be more expensive) but often keep more cash after tax. Educational content like this one should always show the pre-tax figure and flag that after-tax outcomes require a qualified UK accountant.
Canada
Canadian cash-on-cash returns in Toronto and Vancouver have compressed for a decade due to price growth outpacing rent growth. Investors often accept low or slightly negative year-one cash-on-cash in exchange for expected capital growth — a strategy that only works with substantial reserves and a long hold. Include the Land Transfer Tax (and Toronto’s municipal LTT) in your denominator. Reference data fromCMHCfor market fundamentals.
Secondary Canadian markets — Halifax, Moncton, Winnipeg, Edmonton, parts of Quebec — tell a different story: yields there can still support 5%–8% cash-on-cash with responsible leverage, but investors face thinner rental demand, longer vacancies and greater seasonality. Non-resident buyer restrictions have also tightened in recent years, and provinces impose additional foreign-buyer taxes that must be included in the denominator. Any cash-on-cash calculation for a Canadian purchase should explicitly line-item every provincial and municipal tax that applies to your buyer profile.
Australia
Australia’s tax system explicitly recognises “negative gearing,” which can make a slightly negative cash-on-cash return palatable to high-income investors because the loss is deductible against other income. Cash-on-cash still matters — it dictates whether you can hold through a downturn — but many Australian investors focus more heavily on gross rental yield and long-term capital growth. TheReserve Bank of Australiapublishes lending statistics that help you sense-check your loan constant.
A subtle Australian nuance: state-level stamp duty on investment purchases is one of the largest closing costs in the developed world, frequently 4%–5.5% of the purchase price, sometimes higher for foreign buyers. Excluding it from the denominator is one of the most common ways local property influencers overstate cash-on-cash return. Body corporate fees on strata-titled apartments (particularly in Sydney and Melbourne) are another line item that must flow through the numerator; some high-rise buildings carry annual strata fees that consume 15%–25% of gross rent, before any other expense.
Dubai and Abu Dhabi typically show higher gross yields than most Western Tier-1 markets — often 5%–8% gross — driven by expat rental demand and no personal income tax on rental profit. But service charges, cooling fees, agency commissions, DLD transfer fees (4% in Dubai) and financing constraints for non-residents (frequently 50% down for foreigners) all reduce the effective cash-on-cash return. Always price service charges precisely in AED per sq ft per year — a common source of error for international investors.
The UAE also introduces a currency-and-tenancy nuance that few investor guides mention. Rental contracts in Dubai are commonly written for 12 months with rent paid in one, two, or four post-dated cheques — meaning a landlord can collect a significant portion of a year’s rent up front. That timing can flatter early-year cash-on-cash return relative to a Western monthly-rent model, but it does not change the annual result. Meanwhile, sudden regulatory changes to short-term rental permits and building-level restrictions on nightly letting can materially reduce cash-on-cash overnight; investors targeting the Airbnb premium should model their cash-on-cash as if they were forced to operate only long-term, and treat the short-let uplift as a temporary bonus.
Tax and lending rules change frequently. The figures above are educational orientation, not current-year quotes. Always verify SDLT bands, LTT rates, DLD fees, negative-gearing rules and mortgage stress tests with a licensed local professional before you finalise a deal.
Common mistakes and myths
Mistake 1 — Excluding closing costs from the denominator
“Cash-on-cash on a $75,000 down payment.” It is almost never just the down payment. Closing costs, transfer taxes and reserves regularly add 4%–8% to the actual cash outlay. Excluding them inflates the ratio by 5%–10% relative on a typical deal.
Mistake 2 — Slipping principal pay-down into the numerator
Principal amortisation is a wealth-building benefit, not annual cash. It belongs in yourtotal returnanalysis (or IRR), never in cash-on-cash. If your calculator adds principal pay-down to cash flow, throw the calculator away.
Mistake 3 — Using scheduled rent instead of effective rent
Every rental has vacancy, credit loss and turnover downtime. Using the full 12-month scheduled rent as if it will always be collected produces a systematically optimistic cash-on-cash return. In most Tier-1 markets, model at least 5% vacancy even for stabilised assets.
Mistake 4 — Comparing cash-on-cash across very different leverage
A 12% cash-on-cash at 90% LTV is not obviously better than 8% at 60% LTV. The first is riskier by construction. Always report the leverage level alongside the return.
Mistake 5 — Ignoring capital expenditures entirely
Cash-on-cash is a pre-CapEx metric by convention, but that does not mean CapEx does not exist. If the property needs a new roof in year three, yourlifetimecash-on-cash return will look nothing like your year-one number. Sensible investors model a CapEx reserve separately and mentally deduct it when evaluating deals.
Mistake 6 — Confusing cash-on-cash with cap rate
Cap rate ignores financing entirely; cash-on-cash lives and dies by it. Two properties with a 6% cap rate can produce 3% and 11% cash-on-cash depending on the mortgage.
Mistake 7 — Reporting the peak of a value-add curve as if it were year one
Post-refinance cash-on-cash can be genuinely impressive, but it is not the same as year-one stabilised cash-on-cash. Always label the point in the deal lifecycle you are quoting.
Mistake 8 — Modelling scheduled rent from a listing rather than achievable rent
Listing portals show asking rents. Asking rent is what landlords hope to receive; achievable rent is what closed leases actually paid over the last twelve months. In softening markets the two can diverge by 5%–15%. Always cross-check your assumed rent against verified closed-lease data — from your own agent, a management company’s recent leases, or public statistics — before dropping the figure into a cash-on-cash calculation. This single discipline eliminates more optimistic underwrites than any other check we know.
Mistake 9 — Forgetting turnover and re-leasing costs
Every tenant transition triggers costs: leasing commissions, make-ready repairs, cleaning, sometimes carpet replacement, and lost rent during marketing. Even in a market with year-round demand, these costs typically consume 4–8% of a year’s rent when you amortise them across an average holding period. A cash-on-cash calculation that assumes zero turnover cost is systematically wrong. Bake a turnover reserve into your operating expenses — even in small amounts.
Mistake 10 — Treating cash-on-cash as the whole story
Perhaps the most common mistake is philosophical rather than mathematical: assuming that cash-on-cash return alone tells you whether a deal is “good.” It does not. It tells you what one specific dimension of the deal looks like — the current cash yield on your equity. A property with a phenomenal cash-on-cash return but a shrinking population base and a rising crime rate is very different from a property with a mediocre cash-on-cash return in a supply-constrained city with strong rent-growth prospects. Cash-on-cash return is a critical input; it is never the whole judgment.
Myth — “A higher cash-on-cash is always a better deal”
Not so. Cash-on-cash tells you the current cash yield on your equity. It says nothing about asset quality, tenant risk, capital growth trajectory or refinance risk. A 14% cash-on-cash return in a declining town with a single tenant may be dramatically worse, on a risk-adjusted basis, than a 6% cash-on-cash in a supply-constrained coastal market.
How cash-on-cash return connects to other property metrics
Where cash-on-cash sits in the metric family
If you are learning these metrics in sequence, our companion pieces oncap rate,cap rate vs cash flow,DSCR,LTV ratioanddown payment requirementspair naturally with this guide.
Cash-on-cash return vs cap rate — the single most useful comparison
If you only ever compare cash-on-cash return to one other metric, make it cap rate. The two are related but not identical. Cap rate strips out financing, treating the property as if it were bought all-cash at today’s market value; cash-on-cash is the opposite, incorporating financing but ignoring appreciation. A useful mental model is this: cap rate is what theassetyields; cash-on-cash is what yourequityyields. Both matter, because a great asset with a bad loan can produce a poor cash-on-cash return, and a mediocre asset with a great loan can produce a good one — for a while.
Cash-on-cash return vs IRR — the timing dimension
Cash-on-cash return is a single-year snapshot. IRR (internal rate of return) is the annualised return across every cash flow between the day you close and the day you sell, including the sale proceeds. IRR punishes deals that pay slowly and rewards deals that pay quickly; cash-on-cash return is indifferent to timing beyond the current year. That is why a great year-one cash-on-cash can coexist with a mediocre IRR (if the sale is bad) and vice versa. Serious underwriters look at both, and treat any deal where the two diverge sharply as worth extra scrutiny.
Cash-on-cash return vs DSCR — the lender’s cross-check
DSCR (debt service coverage ratio) is what your lender actually cares about: NOI divided by annual debt service. A DSCR of 1.25 means the property generates 25% more NOI than the loan requires. Cash-on-cash return depends on DSCR indirectly — the higher the DSCR, the more cash left after debt service, and the higher the cash-on-cash. If your DSCR is under 1.10 and your cash-on-cash still looks great on paper, one of two things is happening: either you have a very low denominator (small down payment plus stripped-out closing costs), or the model is wrong. Cross-check both. OurDSCR explainercovers this in depth.
How to run the numbers using free LashkariProperties calculators
Rather than rebuild spreadsheets, use our tools to enforce the four-bucket denominator and pre-tax numerator every time. Each is free, mobile-friendly, and requires no account.
Which LashkariProperties calculator to use
Compare year-one cash-on-cash across multiple deals.
Build the income waterfall from gross rent to pre-tax cash flow.
Multi-year projections, refinance events and stress tests.
Size your total cash invested including closing and reserves.
Run your next deal through the numbers
Plug rent, expenses and your loan terms into the free LashkariProperties calculators and see a properly-computed cash-on-cash return in seconds.
Open the ROI calculatorCash flow calculator
Actionable framework: the cash-on-cash checklist
Copy this checklist into your deal notebook. If you cannot tick every box, do not report the return.
- Numerator usespre-taxcash flow — no depreciation, no principal pay-down.
- Vacancy assumption is explicit and defensible for the local market.
- Operating expenses are line-by-line, not a “50% rule” shortcut.
- Denominator includes down payment, closing costs, initial rehab and reserves.
- Year-one figure is labelled as such; refinance-year figure is separate.
- Loan constant is calculated and compared to the property yield.
- Base case is stress-tested for rent, vacancy and rate shocks.
- Result is benchmarked against your personal hurdle rate.
- Return is reported alongside the leverage level.
- Every number has a source — listing, appraisal, quote, or historic actual.
Frequently asked questions
What is a good cash-on-cash return on a rental property?
Many investors target 6%–10% cash-on-cash on a stabilised, leveraged rental in Tier-1 markets, but “good” depends on your hurdle rate, risk tolerance and alternative uses of cash. For lower-risk assets in premium cities, 4%–6% can be reasonable; for value-add strategies, investors often expect 10%+ to compensate for execution risk.
No. Cash-on-cash measures only annual pre-tax cash flow relative to cash invested. Total ROI usually includes appreciation, principal pay-down and tax effects over the full holding period. Cash-on-cash is a snapshot; ROI and IRR describe the full investment lifecycle.
Should I include principal pay-down in cash-on-cash return?
No. Cash-on-cash return uses annual pre-tax cash flow only. Principal pay-down is a wealth-building benefit that shows up in equity and total return calculations, not in the cash yield you actually put in your pocket.
How does leverage affect cash-on-cash return?
Leverage typically increases cash-on-cash return when the property’s cap rate exceeds the loan constant, because you are earning a spread on borrowed money. Leverage also amplifies losses, so a higher cash-on-cash on higher leverage can be riskier than a slightly lower unleveraged yield.
What is the difference between cash-on-cash return and cap rate?
Cap rate uses net operating income divided by property value and ignores financing. Cash-on-cash uses pre-tax cash flow after debt service, divided by the actual cash you invested. Two identical properties with the same cap rate can have very different cash-on-cash returns depending on the loan.
How do I calculate cash-on-cash return with a mortgage?
Take annual pre-tax cash flow (rent minus vacancy, operating expenses and annual debt service), then divide by the total cash you put in (down payment, closing costs, initial rehab and reserves). Multiply by 100 to express as a percentage.
Do I include closing costs in cash-on-cash return?
Yes. Closing costs, lender fees, appraisal, legal and initial reserves are all real cash you put into the deal. Excluding them inflates the ratio and misleads decision-making.
How often should I recalculate cash-on-cash return?
Recalculate at least annually using actual rent, actual operating expenses and current debt service. Many investors also stress-test quarterly when rates move or vacancies change. Year-one cash-on-cash is a projection; year-two onward is where it becomes real.
Is a negative cash-on-cash return ever acceptable?
Occasionally yes — for value-add deals with a clear path to stabilisation, or in appreciation-heavy markets where investors accept negative gearing. But “strategic” negative cash-on-cash requires strong reserves and a firm exit or refinance plan, not hope.
Does cash-on-cash return account for taxes?
Standard cash-on-cash is pre-tax. You can compute an after-tax cash-on-cash by subtracting income tax on rental profit, but effective tax rates vary widely by jurisdiction and personal situation. Educational figures should be pre-tax unless clearly labelled otherwise.
Which is more important: cap rate, cash-on-cash return, or IRR?
They answer different questions. Cap rate values the asset; cash-on-cash measures the cash yield on your equity today; IRR measures the annualised return across the entire hold including sale. Serious investors look at all three plus DSCR.
Can I use cash-on-cash return for short-term rentals or Airbnb?
Yes, but be conservative. Use trailing-twelve-months revenue (not peak-season projections), model higher operating expenses (cleaning, platform fees, utilities, furnishing amortisation) and higher vacancy. Short-term rental cash-on-cash can look attractive but is more sensitive to regulation and demand shocks.
Conclusion and next steps
Cash-on-cash return is not the only metric that matters, but it is the one that keeps you honest. It is deliberately narrow: pre-tax cash flow, divided by real cash invested, expressed as an annual percentage. Get the numerator honest, get the denominator complete, and you have a decision-quality number.
The three-line summary you can take away and use tomorrow: put every dollar of cash you spent at close into the denominator (not just the down payment); use pre-tax cash flow only — no principal pay-down, no depreciation, no appreciation — in the numerator; and never report a single figure without a stress-tested range and the level of leverage attached to it. If you can do those three things consistently, you will already be underwriting more carefully than most of the property market.
The next step is to apply this discipline to a real deal. Take the last property you looked at seriously. Rebuild the numerator using the income waterfall from thecash flow calculator. Rebuild the denominator using thedown payment calculatorand add closing costs, rehab and reserves. Run the resulting cash-on-cash number through theinvestment calculatorfor a five-year projection with a stress test. If the numbers still hold, you have a candidate.
Once you have that discipline, cash-on-cash return stops being a nervous guess and becomes an operating tool. It tells you which deals to write offers on and which to walk away from. It tells you when to refinance a stabilised property and when to hold the current loan. It tells you when a portfolio is genuinely producing cash and when it is quietly drifting toward negative territory. And it tells you — most importantly — when to say no, which is the hardest and most valuable skill in property investing.
Ready to run the numbers on your next deal?
Start with the ROI calculator, then verify with the cash flow calculator. Both are free and mobile-friendly.
ROI calculatorAll calculators
Nothing in this article constitutes personalised financial, tax, mortgage or legal advice. Property tax, stamp duty, transfer tax, lending eligibility and tenancy law vary by country, state and city. Verify all assumptions with licensed local professionals before acting on any deal.
Property Investment Editor at LashkariProperties. Aditi writes about residential and small-multifamily investing across the USA, UK, Canada, Australia and UAE, with a focus on turning fuzzy “deal talk” into repeatable, math-first decisions.
Reviewed by the LashkariProperties Editorial Board · Last updated 6 August 2026.
Related reading on LashkariProperties
- Cap Rate Explained for Property Investors
- Cap Rate vs Cash Flow: Which Metric Should Guide Your Decision?
- DSCR Explained: The Investor Loan Metric That Matters
- Is a 20% Down Payment Required? What Buyers Actually Need
- What Is LTV Ratio and Why Lenders Care
- Browse all Investment Guides →
Tools mentioned in this article
Rental Cash Flow Calculator
Work out monthly and annual cash flow after mortgage, expenses, and a vacancy allowance.
Currency Converter
Convert property prices between currencies using a reference exchange rate.
Stamp Duty & Transfer Tax Calculator
Estimate property transfer tax or stamp duty using banded rates for major markets.
Related reading
- How to Calculate ROI on a Rental Property — The Complete 2026 Investor Guide
Learn how to calculate ROI on a rental property the right way. Total ROI vs cash-on-cash, hidden costs most investors forget, worked examples for USA, UK, Canada, Australia and UAE — plus free calculators.
- Price-to-Rent Ratio: What It Signals About Rent vs Buy Markets
Learn what the price-to-rent ratio really tells you about a housing market, how it differs across Tier-1 cities (US, UK, Canada, Australia, UAE), and how to combine it with a personal rent-vs-buy calculation before you b
- Break-Even Occupancy: The Number Every Landlord Needs
Break-even occupancy tells you the minimum occupancy rate a rental must hit to cover its fixed costs. Learn the formula, worked long-let and short-let examples, and Tier-1 market benchmarks.