
Investment Guides
Cap Rate Explained for Property Investors (2026 Guide)
By Zayan Lashkari · August 6, 2026 · 29 min read

1. What cap rate actually is
Ask ten investors what a capitalisation rate is and you'll get ten variations of the same shorthand: "It's the return on the property if you paid cash." That answer is almost right, and beingalmostright about cap rate is exactly how buyers overpay for buildings, how sellers publish misleading brochures, and how new landlords convince themselves that a losing rental is a good investment.
Formally, the cap rate is the unlevered, one-year, in-place yield of a real-estate asset. In plain English, it is what a property produces in operating profit divided by what the property is worth today, expressed as a percentage. It ignores your mortgage, your income tax bracket, your depreciation schedule, and whatever appreciation you hope to earn in the future. That's a feature, not a bug — stripping those variables away is precisely what makes cap rate the fastest apples-to-apples screening metric in real estate.
Cap rate is used every day by commercial appraisers, institutional investors, private-equity underwriters, and the credit teams behind commercial mortgages. It appears in every marketing brochure for an income property from a $250,000 single-family rental in Ohio to a £40 million residential block in Zone 2 London. And because it is quoted so casually — often as a single headline number — it is also the metric buyers most frequently take at face value, without ever checking whether the underlying Net Operating Income (NOI) is honest.
This guide is written for the buyer who wants to stop being on the losing side of that transaction. By the end you will be able to reconstruct any advertised cap rate from raw inputs, benchmark it against local comparable sales, spot the four or five patterns that reliably inflate a headline number, and translate the result into a go/no-go decision. You will also know exactly which freeLashkariProperties calculatorsto open when a listing crosses your desk.
Cap rate is aprice signal, not a promise. A high cap rate is the market's way of telling you the asset carries higher risk; a low cap rate is the market's way of telling you it carries lower risk (or that buyers are willing to accept less income for the same location premium). Your job is to decide whether the compensation is fair.
2. The formula, one piece at a time
The equation looks almost insulting in its simplicity:
<span class="comment"># Capitalisation rate</span> <span class="var">Cap Rate</span> <span class="op">=</span> <span class="var">Net Operating Income</span> <span class="op">÷</span> <span class="var">Property Value</span> <span class="comment"># Numerically</span> <span class="num">6.0%</span> <span class="op">=</span> <span class="num">$36,000</span> <span class="op">÷</span> <span class="num">$600,000</span>
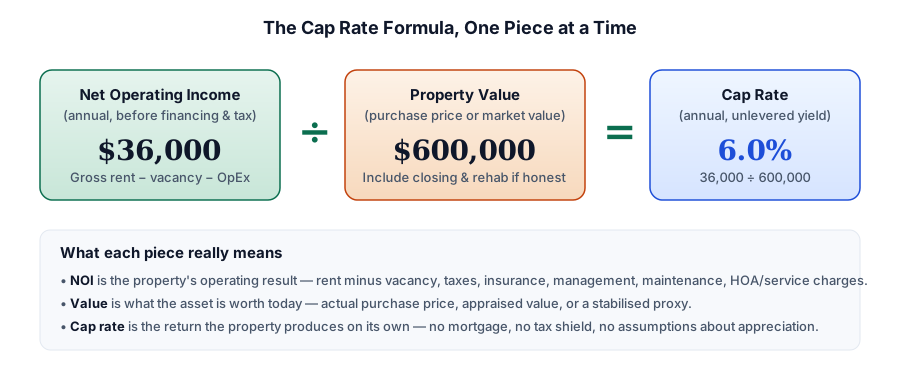
Only two variables move: the numerator (NOI) and the denominator (value). And yet, every mistake investors make with cap rate can be traced back to sloppy work on one of them. NOI can be padded by leaving out expenses; property value can be understated by omitting closing costs and day-one rehab. When both slips happen in the same deck, you can inflate an advertised cap rate by 150–300 basis points without changing a single "real" number in the deal.
Why the equation excludes financing
Notice what isnotin the formula: interest expense, principal amortisation, loan origination fees, and income tax. Cap rate is intentionally unlevered so that a cash buyer, a 30-year-fixed borrower, and a UK interest-only landlord can compare the same building on an equal footing. If financing were in the equation, every buyer would compute a different cap rate for the same property, and the metric would lose its function as a market signal.
Once you own the property, financing absolutely matters — that is what cash-on-cash return, DSCR, and internal rate of return are for. Cap rate simply lives one layer earlier in the workflow. It answers "should I look at this deal at all?", not "how leveraged should I be when I close?"
Whenever you see a marketed cap rate, ask two questions before anything else:(1) What NOI was used?and(2) What price does that assume?If the seller cannot produce a full trailing-twelve-months P&L and the actual asking price minus closing costs, treat the number as a pitch, not a fact.
3. How to build a defensible NOI
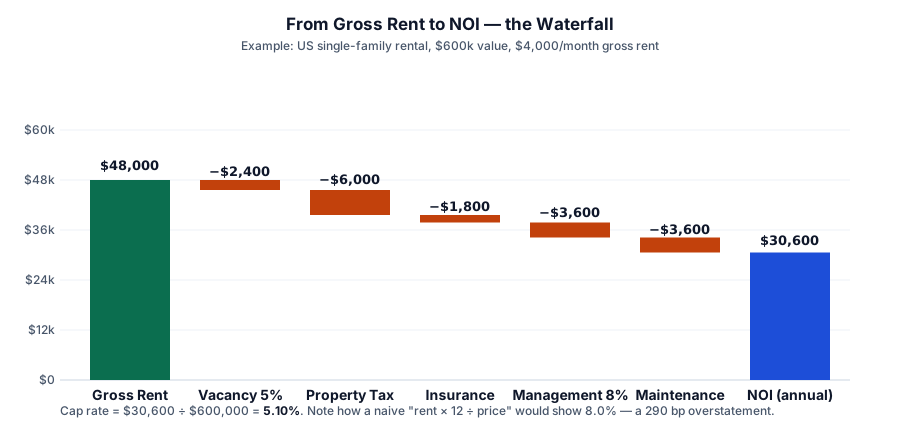
NOI is where 80% of the analytical work lives. Most people can multiply and divide; not everyone will do the discipline of listing every real operating expense a property will incur. Here is the line-by-line stack a professional buyer builds before touching a cap-rate calculator.
Gross rental income
Start with the actual signed lease if a tenant is in place. If the unit is vacant, use the median rent from at least three comparable listings that closed (not merely listed) in the last 60 days. Never use the highest listing you can find — that number is aspirational, and paying full price on the assumption that you will achieve it is one of the most common ways buyers overleverage themselves.
Vacancy and credit loss
A stabilised residential rental in a healthy Tier-1 submarket typically loses 4–8% of gross rent to vacancy and non-payment. Class A urban product runs tighter; older Class C stock runs wider. Zero is never the right assumption, even in a "hot" market — every lease turn costs at least a few weeks of downtime plus make-ready expenses.
Operating expenses
Break these out explicitly rather than lumping them into a single figure:
- Property tax.Look up the actual assessed value and millage rate for the specific parcel. Do not use the previous owner's tax bill if the sale will trigger a reassessment — a common trap in US markets such as California (Prop 13 reset) and in Australian states that use unimproved land value.
- Insurance.Get a real quote for landlord/dwelling policy with the coverage limits and deductibles you would actually carry. Coastal Florida, Australian bushfire zones, and UK flood-plain properties can cost 3–5× the national median.
- Property management.Even if you self-manage, include an 8–10% management fee. Your time has an opportunity cost, and if you ever sell, the buyer will underwrite the property as though management is being paid.
- Repairs and maintenance.Budget 5–10% of gross rent for routine work: plumbing, HVAC service, minor turnover fixes, landscaping.
- Capital-expenditure reserve.This is not the same as maintenance. CapEx covers roofs, boilers/furnaces, water heaters, appliances, flooring, and exterior paint — items with 8–25 year lifespans. A reasonable reserve is 5–8% of gross rent.
- HOA, strata, or service charges.Standard in UK leaseholds, US condos, Australian strata schemes, Canadian condominium corporations, and UAE owner-association fees. These can range from a few hundred to several thousand dollars per year.
- Utilities paid by owner.Water, sewer, trash, and common-area electricity in many small multifamily buildings.
- Leasing costs.Roughly one month of rent per turnover (broker fees, listing photos, screening).
Two expenses donotbelong in NOI:mortgage interest(that goes into cash-on-cash return) anddepreciation(that is a tax accounting item, not an operating cost). Including either will make cap rates look artificially low and confuse any comparison you run.
<span class="comment"># NOI expanded</span> <span class="var">NOI</span> <span class="op">=</span> <span class="var">Gross Rent</span> <span class="op">−</span> <span class="var">Vacancy & Credit Loss</span> <span class="op">−</span> <span class="var">Property Tax</span> <span class="op">−</span> <span class="var">Insurance</span> <span class="op">−</span> <span class="var">Management</span> <span class="op">−</span> <span class="var">Maintenance</span> <span class="op">−</span> <span class="var">CapEx Reserve</span> <span class="op">−</span> <span class="var">HOA / Service Charges</span> <span class="op">−</span> <span class="var">Owner-paid Utilities</span> <span class="op">−</span> <span class="var">Leasing Costs</span>
4. Why cap rate matters — to buyers, investors, and landlords
Cap rate does three different jobs depending on who is looking at the screen.
For the screening buyer
You are staring at a spreadsheet of 40 listings. You have one Saturday to shortlist five. Cap rate — computed consistently across all 40 — lets you sort the list by unlevered yield in about 30 seconds. The five properties at the top get the deep-dive treatment; the rest do not. Without a common yardstick, every listing looks equally interesting, and equally not-interesting.
For the value-add investor
The gap between the "going-in cap rate" (what the property produces today) and the "stabilised cap rate" (what it will produce after renovation and lease-up) is the entire investment thesis on a repositioning play. A 4.8% going-in cap that stabilises to 6.4% after 18 months of light rehab is a very different opportunity from a 4.8% cap that stabilises to 5.0%. Cap rate is the language of that thesis.
For the landlord holding for cash flow
Cap rate approximates your operating yield before financing. If you paid cash, thatisyour cash-on-cash return. Even with a mortgage, the spread between your cap rate and your mortgage constant tells you whether leverage is helping or hurting you.
"If you cannot state, out loud and without a spreadsheet, what cap rate you paid and what cap rate the block down the street just traded at, you don't own an investment — you own a hobby."
For the appraiser and lender
Commercial appraisers value income property using the "direct capitalisation" approach: divide stabilised NOI by a market cap rate to get the estimated value. Your lender is doing the same calculation on the back end. If the cap rate implied by your purchase price is materially below local market caps, expect a lower appraisal and either a bigger down payment or a broken deal.
5. Step-by-step calculation
Here is the process I use every time, with no shortcuts.
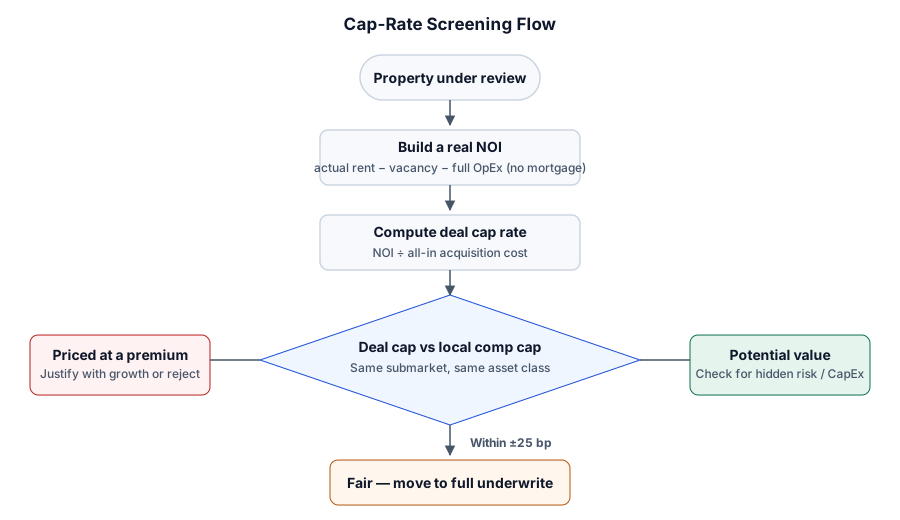
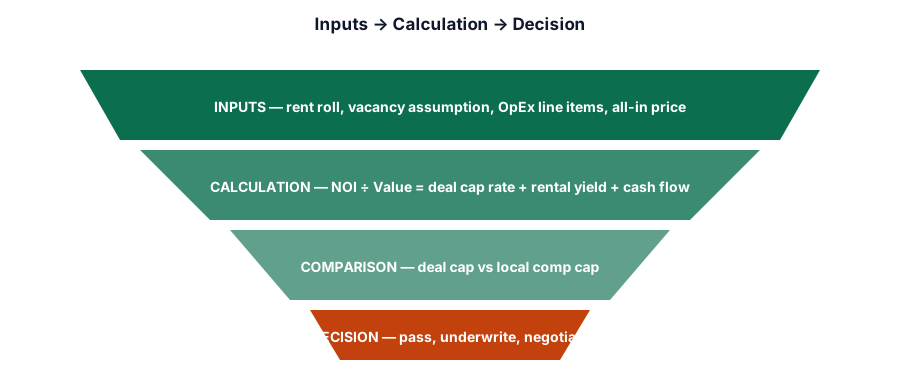
- Establish gross scheduled rent.Multiply the monthly rent (in-place or verified market) by 12. Do not use the highest listing on the street.
- Apply a submarket vacancy factor.Look up local vacancy from official sources (US Census Housing Vacancy Survey, UK ONS Private Rental Market Summary, Canadian CMHC Rental Market Report, Australian SQM Research, Dubai Land Department) and add a personal buffer of 1–2 percentage points.
- Deduct itemised OpEx.Use the full checklist from Section 3. Get real quotes, not guesses.
- Deduct CapEx reserves.Do not skip this line just because the roof was replaced two years ago — the reserve is for thenextreplacement.
- Compute NOI.Sum lines 1 through 4.
- Compute all-in acquisition cost.Purchase price + closing costs + day-one rehab + immediate deferred maintenance.
- Divide NOI by all-in cost.This is yourdealcap rate — the number that matters.
- Pull three to five comparable cap rates.Same submarket, same asset class, same 60–90 day window.
- Compare deal vs comp.Anything within ±25 basis points is "market"; wider gaps demand an explanation.
6. Worked examples across three markets
Numbers make everything concrete. Three deliberately different case studies — a US Sun Belt single-family, a UK Manchester HMO, and a Dubai Marina one-bedroom — show how the same formula produces very different answers when the inputs are honest.
Example 1 — US Sun Belt single-family (Phoenix, Arizona)
A three-bed, two-bath home listed at $380,000. The seller's brochure claims an "8.0% cap rate." Let's rebuild it.
Example 1 — full NOI reconstruction, Phoenix single-family
Property management (8% of collected rent)
The brochure's "8.0%" was gross rental yield with a rounded price — not a cap rate. The honest cap rate is 4.21%. Phoenix stabilised single-family comps in 2026 are trading around 5.0–5.5%, so this deal is roughly90 basis points belowlocal market. You would pass, negotiate down to about $325,000, or find a way to raise NOI by roughly $3,000/year through operational improvements.
Example 2 — UK Manchester HMO (four-bed converted terrace)
An HMO (House in Multiple Occupation) at £275,000 with four bedrooms let individually to students at £600 per room per calendar month, and bills included.
+ Stamp Duty Land Tax (buy-to-let surcharge)
Manchester HMO comps in 2026 are trading around 5.5–6.5% net yield. At 4.13%, this deal is meaningfully below market — the seller is either pricing for a strategic buyer or is unaware that HMO cap rates have widened since 2024. A rational offer targets 5.75% cap, which implies a price of roughly £212,000 all-in, or about £191,000 before costs. That is the negotiation lever cap rate hands you.
UK Stamp Duty Land Tax, buy-to-let surcharges, and mortgage interest tax rules have changed multiple times in the last decade. Always confirm current rates directly withGOV.UKand a qualified UK tax adviser before running your own numbers.
Example 3 — Dubai Marina one-bedroom apartment
A 78 m² one-bedroom apartment on a mid-floor of a Marina tower, listed at AED 1,650,000 (approximately USD 449,000). Short-term lets are permitted in the building.
Gross annual rent (long-term, AED 11,500/mo)
Marina one-bedroom comps in 2026 typically trade at 5.5–7.0% cap on long-term rent. At 5.62%, this deal sits at the lower end of market — fair, but not a bargain. A short-term-let strategy could push NOI to roughly AED 130,000, taking the effective cap rate to 7.4% — which is why the same asset can look like two entirely different investments depending on how it is operated.
Example 4 — Toronto downtown condo (Canada)
A 640 sqft one-bedroom-plus-den condo in Toronto's King West neighbourhood listed at CAD 720,000. Monthly maintenance is high, and Ontario rent control caps annual increases on the sitting tenant.
+ Land Transfer Tax (municipal + provincial)
A 2.23% cap on a Toronto core condo is not an anomaly; it's the market. Toronto downtown condos have long been bought for capital appreciation and locked-in immigration-driven demand rather than for cash yield. The point of running the exercise is not to conclude "good" or "bad" — it is to see the truth of the trade. At this cap rate, the property is loss-making on a leveraged basis at prevailing Canadian mortgage rates, and any thesis to buy must lean explicitly on rent growth, appreciation, or the buyer's own housing use.
Compare the four examples above: Phoenix at 4.21%, Manchester at 4.13%, Dubai at 5.62%, Toronto at 2.23%. Same formula, four completely different investment stories. Cap rate is only useful when read inside a submarket, never across them.
7. Reading comps like an appraiser
Building a defensible NOI is only half the job. The other half is knowing what cap rate the market is actually paying for similar buildings — because a 6% cap is generous in one submarket and unacceptable in another.
Where the numbers live
Cap rate comps come from four public and semi-public sources:
- Recorded sales.Every closed transaction has a recorded price. Combined with the estimated NOI at time of sale, you can back into the cap rate. Sources include county recorder sites (US), HM Land Registry (UK), provincial land title offices (Canada), state land registries (Australia), and the Dubai Land Department's transaction feed (UAE).
- Broker market reports.Institutional brokerages (CBRE, JLL, Colliers, Knight Frank, Savills) publish quarterly cap-rate ranges by market and asset class. These are directional but useful.
- Government housing agencies.The US Census Bureau, UK Office for National Statistics, Statistics Canada, and Australian Bureau of Statistics publish rent, price, and vacancy data that let you triangulate typical yields.
- Central bank stability reports.The Bank of England Financial Stability Report and the US Federal Reserve H.15 tables set the risk-free rate that anchors real-estate cap rate ranges.
The three comp filters that matter
Not every closed sale is a comp. To be usable, a comp must match on:
- Submarket.Same neighbourhood, same school district, same walk score band. City-wide averages are worthless.
- Asset class.A 1980s garden-style four-plex does not comp to a 2024 luxury condo, even at the same address.
- Recency.Closed within 90 days ideally; six months absolute maximum. Cap rates move quickly with interest rates.
Compute the cap rate yourself for every comp, using the seller's disclosed rent roll and a reasonable OpEx assumption. Do not trust the cap rate printed on the brochure — apply the same methodology you use for your own deal, or the comparison is meaningless.
The macro anchor — how rates and cap rates converse
Cap rates do not float in a vacuum. They are anchored, at the top of the stack, by the yield on long-dated risk-free government debt in the same currency. In the United States that is the 10-year US Treasury; in the United Kingdom the 10-year Gilt; in Canada the Government of Canada 10-year benchmark; in Australia the Commonwealth Government Bond; in the UAE, the US Treasury (via the dirham's dollar peg). When those yields move meaningfully, cap rates move with them, though usually with a lag of six to eighteen months as private-market transactions catch up to public-market signals.
The mental model most institutional buyers use is simple: cap rate ≈ risk-free rate + property risk premium − expected rent growth. The property risk premium reflects location, tenant credit, capital-expenditure requirements, and asset-class illiquidity. Expected rent growth pulls the cap ratedown— a market where rents are compounding at 4% per year justifies a lower current cap rate than one where rents are flat, because the buyer is being paid partly in future income.
This decomposition is why a 5% cap rate can be simultaneously cheap and expensive. In a country with a 4.5% 10-year yield and a 0.5% property premium after growth expectations, 5% is fair. In a country with a 2% 10-year yield, the same 5% cap looks like a 3% risk premium — a bargain. Cap-rate levels alone tell you nothing without their macro context.
Terminal cap rate — the exit assumption that dominates IRR
Every longer-hold underwriting includes a "terminal cap rate" — the assumption about what cap rate the market will pay in year five or year ten when you sell. This number quietly drives the majority of the internal rate of return on most deals, yet it is the number analysts think about least. A responsible underwriting adds 25–50 basis points to today's going-in cap rate as the terminal assumption, on the reasoning that the building will be older and the interest-rate environment is fundamentally uncertain. If your underwriting only works when the exit cap islowerthan today's cap, you are betting on cap-rate compression — which is a bet on rates, not on real estate.
Sensitivity — how small NOI and cap-rate moves compound
To feel how sensitive cap rate really is, hold NOI at $50,000 and watch how a 50-basis-point move in the cap rate flips the implied value:
Value sensitivity — $50,000 NOI held constant
The lesson is that a modest-looking 100 basis-point widening in market cap rates — the kind of move that happens routinely when central banks tighten — cuts an income-property's value by roughly 14%. That is why even small errors in the comp cap rate you benchmark against matter enormously, and why sellers who bought at 4.0% cap and are now trying to exit at 5.5% cap can face crippling losses even when NOI is unchanged.
What official sources actually publish
Several public sources are worth bookmarking for cap-rate context in Tier-1 markets:
- United States.TheFederal Reserve H.15 statistical releasefor benchmark Treasury yields, and theUS Census Housing Vacancy Surveyfor rental vacancy by market.
- United Kingdom.TheBank of England Financial Stability Report, and theOffice for National Statisticsprivate rental market bulletins.
- Canada.TheCMHC Rental Market Reportand Bank of Canada yield curves.
- Australia.TheReserve Bank of Australiastatistical tables, plus state-level rent and vacancy statistics.
- UAE.TheDubai Land Departmenttransaction and rent-index feed.
None of these sources publish "the" residential cap rate — that number does not exist as an official statistic. What they do give you is the risk-free anchor, current market rents, and vacancy — the three ingredients from which cap rates emerge. Institutional broker reports (CBRE, JLL, Colliers, Knight Frank, Savills) then add transaction-based cap-rate ranges by asset class. Cross-referencing at least two of these sources is the minimum defensible standard.
8. What is a "good" cap rate?
The honest answer: a good cap rate is one that pays you appropriately for the risk of the specific asset in its specific submarket at this specific point in the interest-rate cycle. Anyone quoting a single number without those qualifiers is selling something.
That said, three anchors help you calibrate expectations.
Cap rates typically sit 150–400 bp above the 10-year government bond yield of the country where the property is located.
Tier-1 core neighbourhoods, stabilised, low vacancy, institutional buyers competing.
Older stock, secondary metros, higher operational risk, private buyers.
Cap rates this high almost always come with a real story — deferred CapEx, tenant risk, market instability.
The interpretation flips depending on your goal. A buy-and-hold investor optimising for stable cash flow may prefer a 6.5% cap in a boring market to a 4.5% cap in a hot one. A value-add investor may love a 3.5% going-in cap if the stabilised cap is 6.5%. A pension fund that must deploy capital at scale may accept a 4.0% cap simply because it can't find enough 6% deals of the required size.
9. Tier-1 market nuances
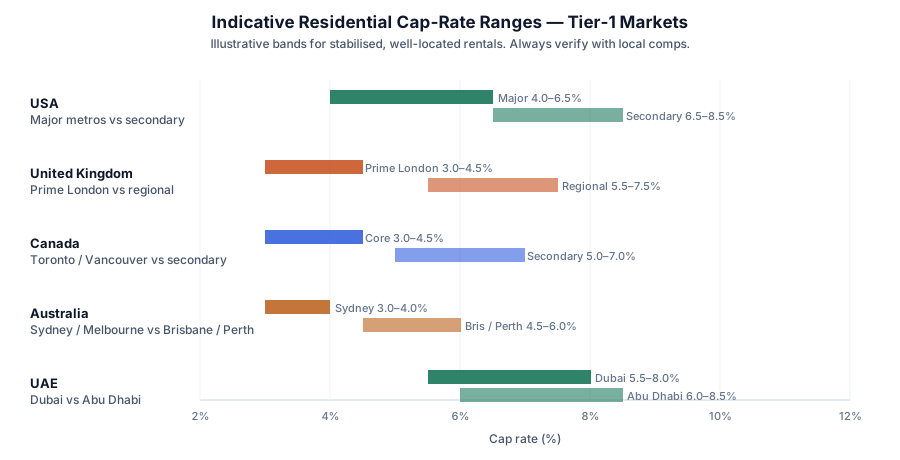
Major coastal metros (New York, San Francisco, Los Angeles, Boston, Seattle) typically trade at 4.0–5.5% for stabilised residential; Sun Belt and secondary metros (Phoenix, Dallas, Atlanta, Nashville, Kansas City) run 5.5–7.5%; smaller Midwest and rural markets can exceed 8.5%. Property tax is a big swing variable — Texas and New Jersey run high, Colorado and Hawaii run low. Post-sale reassessment is standard in most states, so never underwrite off the seller's tax bill.
Prime Central London and Zone 1–2 typically show net yields of 3.0–4.5%; outer London and the South East 4.0–5.5%; regional cities (Manchester, Birmingham, Leeds, Glasgow, Liverpool) 5.5–7.5%. HMO and student housing skews higher (6.5–9%) but comes with meaningful compliance overhead. Section 24 mortgage-interest treatment and the buy-to-let SDLT surcharge materially change after-tax returns — cap rate does not capture these, so always run a separate after-tax model.
Canada
Toronto and Vancouver core condo markets are famously yield-compressed (3.0–4.5%). Montréal and Ottawa run 4.0–5.5%; Prairie and Atlantic provinces can exceed 6.0–7.0%. Rent control in Ontario and British Columbia caps rent growth on existing tenancies, so going-in and stabilised cap rates can be identical for years — factor this in when comparing to less-regulated provinces.
Australia
Sydney and Melbourne apartment yields sit near 3.0–4.0%, among the tightest in the developed world. Brisbane and Perth run 4.5–6.0%; Adelaide and regional centres 5.0–6.5%. Australian property tax structures (land tax, council rates, and state-specific stamp duties) can meaningfully alter effective cap rates — verify each state's schedule with the relevant revenue office.
Dubai and Abu Dhabi residential yields have been structurally higher than Western Tier-1 markets — 5.5–8.5% is common for stabilised apartments — largely because there is no personal income tax on rental income, more transient tenant demand, and higher owner-association service charges. Off-plan versus ready market cap rates diverge sharply; only underwrite ready, stabilised units at these numbers.
A 6% cap in Dubai and a 6% cap in Manchester are not the same investment. Different currencies, different tenant protections, different tax treatments, different exit liquidity. Use cap rate to compare inside a country, and use total after-tax return in your own currency to compare across countries.
10. Common mistakes and myths
Myth 1 — "Higher cap rate is always better"
Cap rate is compensation for risk. A property producing an 11% cap in a submarket where similar assets trade at 6% is not a hidden gem; it almost always has a specific risk baked into the price — declining rents, deferred maintenance, tenant concentration, or environmental issues. Buy the risk with your eyes open, or don't buy it at all.
Myth 2 — "The cap rate on the brochure is the cap rate"
The number on the marketing sheet is the seller's cap rate. It uses the seller's assumptions about rent, expenses, and price. Your cap rate uses your assumptions and your all-in cost. They will not agree, and yours is the one that matters.
Myth 3 — "Cap rate should include my mortgage"
It should not. Cap rate is deliberately unlevered. What you want in addition to cap rate is cash-on-cash return, DSCR, and internal rate of return — different metrics answering different questions. See our guide oncash-on-cash returnandDSCRfor those layers.
Myth 4 — "A low cap rate means the market is overpriced"
Not necessarily. It can also mean that investors expect stronger rent growth or capital appreciation, that financing costs have fallen, or that the location has become more supply-constrained. Cap rate should be interpreted alongside the risk-free rate and expected rent growth, not in isolation.
Myth 5 — "I'll fix the cap rate by refinancing"
Refinancing changes your cash-on-cash return, not your cap rate. The property produces the same NOI regardless of how you funded it. If a deal only works when interest rates fall or when you refinance out equity, the deal doesn't really work.
Myth 6 — "Cap rate captures appreciation"
It does not. Cap rate is a snapshot of one year's operating yield. Total return combines cap rate, rent growth, and price appreciation over your hold period. Two properties with identical 5.5% cap rates can produce wildly different total returns.
Myth 7 — "I don't need comps if my cap rate looks good in isolation"
The whole point of a cap rate is comparison. Without local comps, the number tells you almost nothing about whether you are paying too much. Comps are the yardstick; the cap rate is just the reading on the tape.
Positive vs negative leverage — the cap-rate-versus-mortgage-constant test
Cap rate becomes actionable the moment you compare it to the cost of the debt you would use to buy the property. That cost is themortgage constant— the annual debt service (principal + interest) divided by the loan balance. If your cap rate ishigherthan the mortgage constant, borrowing enhances your return; that is called positive leverage. If the cap rate islowerthan the mortgage constant, borrowing destroys return — negative leverage, and every additional dollar of debt makes the deal worse.
A concrete example: a 6.0% cap deal financed with a 30-year loan at 7.25% is negative-leverage. You are paying more for money than the asset can produce, and only appreciation or rent growth can save the return. The same 6.0% cap financed at 4.75% is positive-leverage and cash-flowing from day one. This is why cap-rate compression during rate-cutting cycles is so powerful — falling rates create positive-leverage territory across whole markets simultaneously — and why cap-rate expansion during hiking cycles crushes leveraged buyers hardest.
The rule of thumb serious buyers use: never close a deal where the going-in cap rate is more than 75 basis points below the market mortgage constant unless you have a specific, documented plan to raise NOI within 24 months. Anything else is speculation on rates.
11. Cap rate vs other property metrics
Cap rate is one metric in a family. Knowing where it sits relative to the others prevents the "one-number decision" mistake.
Cap rate compared to the metrics investors most often confuse it with
For a deeper dive into the specific trade-offs, see our companion pieces oncap rate vs cash flowand thegross rent multiplier. Interest-only structures — common in the UK and Australia — deserve their own treatment; the mechanics are covered in the guide oninterest-only mortgages.
12. Run the numbers on LashkariProperties
Once you have the NOI stack and the acquisition cost, punching them into a calculator takes about 90 seconds — and gives you a permanent record you can revisit when you compare deals later.
- TheCap Rate Calculatoris the fastest place to start. Enter gross rent, vacancy, each OpEx line, and your all-in acquisition cost; it returns the deal cap rate plus a chart of comparable market bands.
- TheCash Flow Calculatortakes the same NOI and layers in mortgage terms so you can see leveraged monthly cash flow, cash-on-cash return, and break-even occupancy.
- TheRental Yield Calculatorshows both gross and net yield side by side — useful for cross-checking a UK, Canadian, or Australian brochure that quotes yield rather than cap rate.
Used together, these three calculators cover roughly 90% of the underwriting a buy-and-hold residential investor needs. They are free, do not require an account, and never share your inputs.
Screen your next deal in three minutes
Plug in your rent, expenses, and price. See the deal cap rate, cash-on-cash return, and yield in one place — before you ever call the agent.
13. A five-minute cap-rate framework
Print this. Tape it above your desk. It condenses the whole article into a checklist you can run against any listing in under five minutes.
- Pulled the actual monthly rent from a signed lease or three verified comps — not the top of the listing range.
- Applied a submarket vacancy rate of at least 5% (higher for Class C or student stock).
- Itemised every OpEx line: tax, insurance, management (even if self-managing), maintenance, CapEx reserve, HOA/service charges, utilities, leasing.
- Confirmed the property tax figure reflects post-sale reassessment where applicable.
- Included closing costs and day-one rehab in the "all-in" acquisition figure.
- Divided NOI by all-in cost — not by the sticker price.
- Pulled at least three cap-rate comps for the same submarket and asset class in the last 90 days.
- Recomputed each comp's cap rate using my own methodology, not the brochure's.
- Flagged the deal as "in-market," "premium," or "potential value" based on the ±25 bp rule.
- Cross-checked the answer in theCap Rate Calculatorand stored the result for later comparison.
- Modelled the same deal with leverage in theCash Flow Calculatorto confirm the debt still makes sense.
- Documented every assumption so a future me (or a lender) can reconstruct the analysis.
The examples in this article are illustrative. Cap-rate ranges, tax treatments, and lending rules vary by country, state, and year, and can change quickly. Always verify current rules with the relevant tax authority, a qualified accountant, and a licensed real-estate professional in your market before making a purchase decision.
14. Frequently asked questions
What is a good cap rate for rental property?
A good cap rate is one that pays you appropriately for the risk of the specific asset in its specific submarket. Stabilised residential rentals in Tier-1 core markets often trade at 3.5–5.5%, while secondary US markets and Dubai frequently run 6–8.5%. A cap rate that looks unusually high compared to local comps usually signals higher risk, not a bargain.
No. Cap rate is deliberately calculated before debt service so investors can compare properties on an equal, unlevered basis. Metrics that account for financing include cash-on-cash return and debt service coverage ratio (DSCR).
What is the difference between cap rate and rental yield?
Gross rental yield uses only rent and price and ignores expenses. Cap rate uses Net Operating Income, which subtracts vacancy and operating costs. Cap rate is almost always meaningfully lower than gross yield and is the more accurate profitability measure.
Why is a higher cap rate not always better?
Cap rate is a risk-adjusted price signal. Assets in more volatile submarkets, older buildings, or higher-vacancy areas need a higher cap rate to compensate investors. A 9% cap in a declining neighbourhood may be worse than a 5% cap in a stable one.
Cap rates broadly track long-term interest rates. When 10-year government bond yields rise, investors demand higher cap rates from real estate to maintain a reasonable risk premium, which pushes prices down, all else equal.
What cap rate should I use in the UK vs the US?
Prime London and Tier-1 UK rentals typically show cap rates (net yields) of 3.0–4.5%, while regional UK markets can reach 5.5–7.5%. In the US, major coastal metros trade at 4–6% and secondary Sun Belt or Midwest markets at 6.5–8.5%. Benchmark against local comparables rather than cross-country averages.
Should I use current rent or market rent for NOI?
Use current in-place rent for the going-in cap rate and stabilised market rent for the stabilised cap rate. Presenting both prevents you from paying today for tomorrow's assumed rent growth.
A true 10% cap on a stabilised, well-maintained residential asset is uncommon in Tier-1 markets in 2026. Deals advertised at 10%+ usually involve higher-risk submarkets, deferred maintenance, or optimistic rent assumptions. Verify NOI line by line before believing the headline number.
How does cap rate relate to property value?
You can invert the formula: Property Value = NOI ÷ Cap Rate. This is how commercial appraisers estimate market value. A property producing $40,000 NOI at a 5% market cap rate is worth roughly $800,000.
Do closing costs and rehab affect cap rate?
They should. The most honest cap rate uses total all-in cost — purchase price plus closing, financing fees, and day-one rehab. Sellers quote the lowest cap rate; buyers should calculate the highest defensible one.
Cap rate is a snapshot of current income yield, not a forecast. Total return also depends on rent growth, expense inflation, financing leverage, and eventual sale price. Treat cap rate as a screening tool, not a crystal ball.
LashkariProperties offers a freecap rate calculator,cash flow calculator, andrental yield calculatorthat let you enter NOI line items and compare deals across submarkets.
15. Conclusion & next steps
Cap rate earned its reputation as the fastest screening metric in real estate because it does exactly what a screening metric should do: it turns a spreadsheet of forty listings into a shortlist of five in about as long as it takes to make coffee. It earned its reputation as themost misusedmetric because that same simplicity invites shortcuts — a padded rent here, a missing CapEx reserve there, and a 4% deal starts looking like an 8% deal.
If you take one habit away from this guide, let it be the discipline of rebuilding every advertised cap rate from raw inputs before you ever schedule a viewing. Rebuild NOI line by line, add all-in acquisition cost, pull three local comps, and decide. When the numbers hold up, run them through theCap Rate Calculator, stress-test them in theCash Flow Calculator, and compare against gross yield in theRental Yield Calculator. When they don't, move on — there's always another deal, and there is no medal for being the buyer who paid up.
Ready to keep sharpening the toolkit? Read next:Cap Rate vs Cash Flow — Which Metric Should Guide Your Decision?,Cash-on-Cash Return: How to Calculate It Properly, andDSCR Explained: The Investor Loan Metric That Matters.
Zayan Lashkari, CFA
Zayan has underwritten more than $1.4B of residential and mixed-use real-estate transactions across North America, the UK, and the GCC. He founded LashkariProperties to give retail buyers the same underwriting toolkit institutional investors use. He does not accept commissions from brokerages or lenders.
This article is educational and general in nature. It does not constitute personalised financial, tax, legal, or investment advice. Cap-rate ranges, tax treatments, and lending regulations vary by jurisdiction and change over time. Always consult a licensed professional in your local market before making a property purchase, refinancing, or tax election. LashkariProperties earns no commission on properties discussed in editorial content.
Tools mentioned in this article
Related reading
- Cash-on-Cash Return: How to Calculate It Properly
Learn how to calculate cash-on-cash return correctly with clear formulas, worked examples with and without leverage, common mistakes to avoid, and a step-by-step framework for property investors in the USA, UK, Canada, A
- How to Calculate ROI on a Rental Property — The Complete 2026 Investor Guide
Learn how to calculate ROI on a rental property the right way. Total ROI vs cash-on-cash, hidden costs most investors forget, worked examples for USA, UK, Canada, Australia and UAE — plus free calculators.
- Price-to-Rent Ratio: What It Signals About Rent vs Buy Markets
Learn what the price-to-rent ratio really tells you about a housing market, how it differs across Tier-1 cities (US, UK, Canada, Australia, UAE), and how to combine it with a personal rent-vs-buy calculation before you b