
Investment Guides
Break-Even Occupancy: The Number Every Landlord Needs
By Adeel Lashkari · August 6, 2026 · 31 min read

Why this number matters
Most landlords, especially first-time buyers, evaluate a rental with two questions:How much will it rent for?andHow much is the mortgage?If the first number comfortably exceeds the second, the deal feels safe. That mental model is where a huge share of rental losses begin.
The reason is straightforward. A rental never rents at 100% of the time. Tenants move out. Guests cancel. Boilers fail. Regulations change. The real question is not whether the property covers costs when it is fully occupied — almost every property does. The real question is:how much can occupancy fall before I start losing money each month?
That single number has a name. It is calledbreak-even occupancy, and it is the most useful stress-test metric a landlord can compute in under fifteen minutes. Institutional buyers of apartments and hotels have used it for decades. Individual landlords rarely calculate it — which is precisely why so many overpay for the rental income they eventually receive.
This guide walks through the formula, three worked examples (a long-let condo, a short-let apartment, and a rate-shock scenario), and how the number differs across the USA, UK, Canada, Australia and UAE. You can verify every calculation live using theLashkariProperties break-even occupancy calculator, part of our free suite of property-finance tools built specifically for landlords who want to run the numbers before they buy.
Snapshot
Break-even occupancyis the minimum percentage of time a rental must be occupied at market rent for income to cover fixed costs. If it is 80%, the property must stay rented at least 80% of the year to avoid losing money. Compare it to the realistic long-run occupancy of your submarket — the gap is your safety margin.
Definitions and formula
The core formula
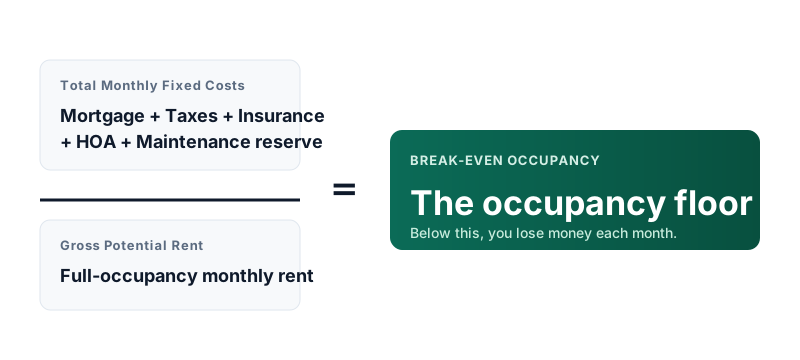
Break-even occupancy is elementary arithmetic:
Break-Even Occupancy (%) = ( Total Monthly Fixed Costs ÷ Gross Potential Rent ) × 100
What counts as a fixed cost?
A cost isfixedfor break-even purposes if you owe it regardless of whether the property is occupied. In most jurisdictions that means:
- Mortgage principal and interest— the biggest line for most leveraged landlords.
- Property tax(or council tax equivalent where the landlord pays it).
- Building and landlord insurance, including any liability rider.
- HOA, strata, service charge or ground rent— the community fees that continue during vacancy.
- Baseline utilitieswhere the landlord pays them even when empty (common in short-let and some studio setups).
- Maintenance reserve— a monthly accrual for future repairs, typically 5–10% of gross rent for long-lets and 8–15% for short-lets.
- Fixed compliance costs— gas safety, EICR, smoke alarm inspections, licensing fees where required.
What is gross potential rent?
Gross potential rent (GPR)is the rent the property would generate at 100% occupancy at fair market rate. For a long-let, that is the monthly rent from comparable listings. For a short-let, it is the average daily rate (ADR) multiplied by the number of nights in the month.
Crucially, GPR is a benchmark, not a forecast. You use it as the denominator because you want the break-even ratio to be comparable across properties, cities, and years. Discounting the denominator in advance would hide the actual sensitivity of the deal.
Variable costs and where they go
Utilities that only run when a guest is present, cleaning fees, platform commissions and management fees arevariable. Purists split them out and use a slightly different equation:
Break-Even Occupancy = Fixed Costs ÷ ( Rent per period − Variable Cost per period )
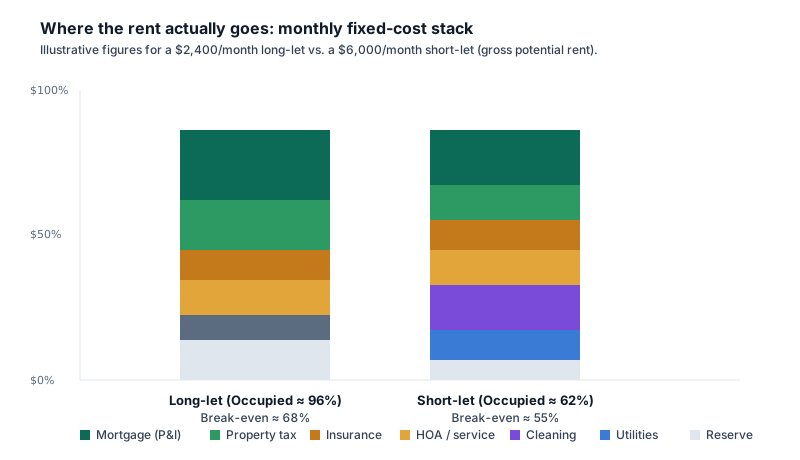
This variation shows up in short-let analysis, where variable costs (cleaning, laundry, utilities, guest supplies) can easily hit 25–35% of nightly revenue. For long-lets, variable costs are small and most landlords fold them into a single "operating cost" figure. Both approaches produce useful answers; we show both below.
Related terms
Break-even ratio (BER): operating expenses plus debt service divided by gross potential income — the commercial equivalent, expressed as a decimal.Debt service coverage ratio (DSCR): net operating income divided by debt service; a DSCR of 1.20 implies a break-even occupancy near 83% at typical expense ratios.Vacancy rate: the observed percentage of unoccupied time; the mirror image of occupancy.
Why landlords must know it
Rental income statements make three metrics look like they mean the same thing: gross yield, net yield and cash flow. They don't. A property can show a healthy gross yield, a positive net yield after "typical" expenses, and still lose money in a bad year because the assumed vacancy was optimistic. Break-even occupancy re-frames the question in a way that is impossible to fudge.
Consider two hypothetical apartments a landlord is comparing:
Two-apartment comparison: the yield rewards the more fragile deal
Apartment A shows the higher gross yield. Every popular yield calculator will flag it as the better investment. But its break-even occupancy is 90% against a realistic long-run occupancy of 94%. A single two-month void — utterly normal in most cities — and Apartment A goes into loss for the year. Apartment B, with the weaker yield, absorbs a full quarter of vacancy before it hits the red.
"Yield tells you the reward. Break-even occupancy tells you how much room for error you have. Sophisticated landlords look at both — and when they conflict, they trust break-even."— LashkariProperties Research
This is why break-even occupancy is central to how commercial lenders underwrite multifamily and hotel deals, and why individual landlords should adopt the same discipline before they commit hundreds of thousands of dollars, pounds, or dirhams to a purchase.
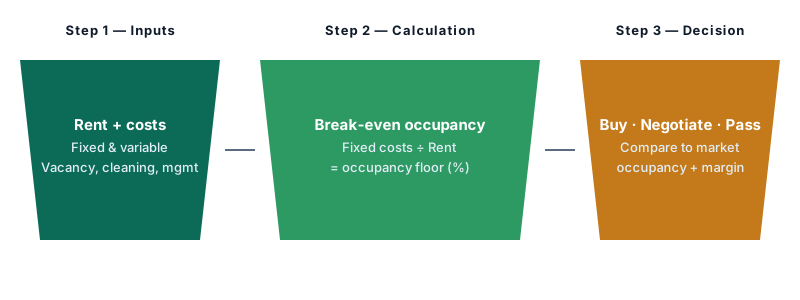
Step-by-step calculation
Step 1 — Nail down monthly fixed costs
Start with a spreadsheet or a clean sheet of paper. Every landlord underestimates costs; the goal is to be conservative. Break each expense into a monthly figure and add:
- Mortgage principal and interest at youractualquoted rate. If you are on a variable or a fixed-then-reset product, model the reset rate as well.
- Property tax divided by 12.
- Annual insurance premium divided by 12.
- HOA, strata, service charge or ground rent — as billed.
- Maintenance reserve. Add 5% of gross rent for a modern build, 8% for a mid-life property, 10%+ for anything older or already showing wear.
- Compliance and licensing: gas safety, EICR, boiler service, fire alarms, short-let permits.
Step 2 — Set gross potential rent honestly
For a long-let, pull five to eight comparable listings currently on market or recently let, and use the median. Do not use asking rent; use signed rent where the data is available. In the UK the Office for National Statistics'rental price indexis a useful cross-check. In the US, HUD's Fair Market Rents provide a floor for urban submarkets.
For a short-let, use AirDNA, PriceLabs, or your local platform's Smart Pricing suggestion, taking the 25th percentile of your neighbourhood's ADR as a defensible estimate. Then multiply by 30 (or 28/31 for the specific month) to get gross potential rent.
Step 3 — Include occupancy-driven costs
For a short-let this step is critical. Estimate per-stay cleaning cost, laundry, guest supplies, platform commission, and any management commission. Convert those into a per-night variable cost. For a long-let, roll a modest management fee (0% if self-managed, 8–12% of collected rent if outsourced) into the fixed side, since it broadly tracks whether the property is tenanted or not.
Step 4 — Divide
Divide monthly fixed costs by gross potential rent. Multiply by 100. That's your break-even occupancy. If you separated variable costs, divide fixed costs by(rent per period − variable cost per period). The result is now expressed in occupied periods (nights, weeks, months) rather than time.
Step 5 — Compare to reality
Look up realistic occupancy for your submarket. For long-lets in Tier-1 cities, expect long-run market occupancy of 92–97%. For short-lets, expect 55–75% depending on city, seasonality and regulation. Subtract break-even from realistic occupancy. That's yoursafety margin.
Best-practice safety margins
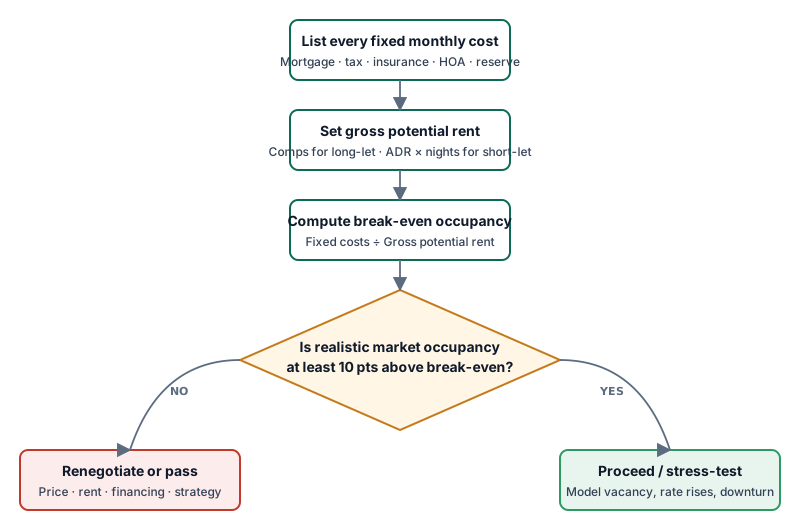
Long-let:aim for a break-even at least 10 percentage points below realistic market occupancy — so 82% or lower if your market runs at 92%.Short-let:aim for at least 15 points below, and stress-test with a 20-point drop. Short-let revenue is more volatile and more exposed to regulation.
Worked example — long-let condo in Austin, Texas
A US-based landlord is looking at a 2-bed condo in a mid-tier Austin neighbourhood. Purchase price is $420,000, with 25% down and a 30-year fixed conventional mortgage at 6.75%. Comparable 2-bed rentals in the same building are letting at $2,400/month.
Austin condo — monthly fixed cost buildup (USD)
The break-even isabove 100%. That result — impossible to satisfy in the real world — tells the landlord that at this price, this rate, and this rent, the property cannot cover its own fixed costs even fully occupied. This is the classic outcome of high property tax combined with a leveraged purchase at elevated interest rates, and it is why Austin was one of the first US markets to see net rental yields compress below zero for financed buyers during 2023–2025.
The landlord has three levers:
- Negotiate the price.A $340,000 purchase (roughly a 19% discount) drops the mortgage to $1,654 and the tax to $595, and pulls break-even to about 100% — still far too fragile.
- Put down more equity.Increasing the down payment to 45% cuts the mortgage to $1,504 and drops break-even to about 118% — still not viable.
- Change the strategy.If short-let regulation allows it, using the property as a mid-term rental for corporate stays at $3,600/month equivalent shifts break-even to a workable 96%.
None of these levers were obvious from the gross yield of 6.9%. Only the break-even calculation exposes how fragile the deal is at current financing costs. In Tier-1 US markets during 2025–2026, this profile is common. Landlords who don't run the number frequently discover it only after closing, by which time the choices are much narrower.
Watch out
Property taxes in Texas, New Jersey, and Illinois are among the highest in the US and are effectively fixed at purchase. Always compute break-evenaftera full tax reassessment based on your purchase price, not the previous owner's assessed value.
Worked example — short-let apartment in Dubai
A UAE-resident investor is buying a 1-bed apartment in Dubai Marina for AED 1,400,000. They pay 40% cash and finance the balance at 4.5% over 25 years. Local operators report ADR of AED 550 and short-let occupancy of about 68% over the trailing twelve months. The building charges an annual service fee.
Dubai Marina 1-bed — short-let monthly buildup (AED)
Now for the revenue side. At AED 550 ADR × 30 nights, gross potential rent is AED 16,500. But short-let has variable costs per occupied night:
Dubai Marina 1-bed — variable cost per occupied night (AED)
Now compute break-even in nights:
AED 8,317 ÷ AED 290 per occupied night = 28.7 nights per month
Twenty-nine nights out of thirty. Expressed as a percentage, that is a break-even occupancy of96%. Realistic market occupancy is 68%. The deal is deeply underwater at these assumptions.
What breaks the deal is not the ADR; it is the combined weight of the service charge, mortgage on 60% LTV, and the management/platform stack. Common fixes short-let investors apply:
- Self-manage.Removing the 20% management fee lifts contribution per night to about AED 320 and drops break-even to 87% — still fragile, but survivable in peak season.
- Raise ADR seasonally.Dubai Marina ADR routinely spikes above AED 900 in Q4 and Q1. A blended ADR of AED 700 pushes break-even below 60% at 68% market occupancy — a defensible investment case.
- Go longer-let hybrid.Alternating 30-day corporate stays in shoulder months at AED 12,000 with peak short-let in high season often produces the strongest risk-adjusted return.
Notice how the calculation exposes the strategy question. The investor is not choosing between "buy" and "don't buy" — they are choosing between operating models, and the break-even number quantifies the difference.
Dubai, UK, USA, Canadian and Australian short-let regimes are all subject to change and vary by emirate, borough, state, province and city. The Department of Economy and Tourism (DET) permit, tourism dirham, and building consent requirements in Dubai in particular have evolved several times since 2020. Verify current rules with your operator, local authority, or a licensed property lawyer before committing capital.
Worked example — rate shock on a UK buy-to-let
A UK landlord bought a Manchester 2-bed for £220,000 in 2021 with a 75% interest-only mortgage at 1.9% on a five-year fix. The property lets for £1,250/month. Their original numbers looked comfortable.
Manchester BTL — original vs. reset (GBP)
Between the original and the reset, nothing structural changed. The property is the same, the tenant is the same, the rent even went up. But because the interest rate quadrupled, break-even occupancy jumped from 49% to 87%, and the landlord's safety margin collapsed from 45 points to about 8. This is exactly the pattern that pushed thousands of accidental UK landlords into forced sales during 2023–2024, and why the Bank of England now flags residential landlords in itsFinancial Stability Reportas a channel through which higher rates transmit into housing markets.
The lesson is not "avoid interest-only" — it'scompute break-even at the reset rate, not the current teaser rate. Every landlord signing a fixed-rate mortgage should model the reset. Every landlord on variable should model +200bps as a baseline stress test, and +400bps as a resilience test.
If break-even occupancy exceeds realistic market occupancy at your worst plausible interest rate, you don't have an investment — you have a bet on rates.
Tier-1 market nuances
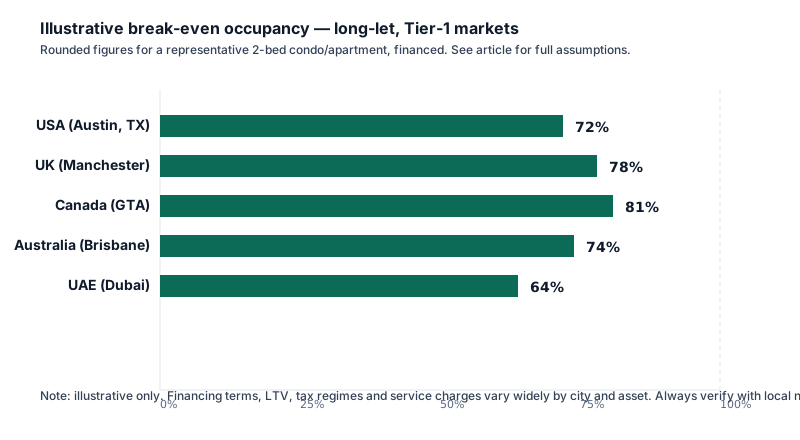
The US is heterogenous. Property tax alone ranges from ~0.3% (Hawaii) to ~2.5% (New Jersey, Illinois, parts of Texas) of assessed value. State-level insurance costs — especially in Florida and Louisiana following the last five hurricane seasons — have doubled or tripled since 2020, structurally raising the fixed-cost stack. Landlords should model insurance premiums at the current renewal quote, not the seller's disclosed figure. HOA fees in condo-heavy metros (Miami, Chicago, DC) frequently exceed $500/month and are voted up annually. Always assume 5% annual growth in HOA when building a five-year break-even path.
UK landlords face a different structural pressure:Section 24tax treatment of mortgage interest for individually-held BTLs. Since April 2020, mortgage interest is no longer deducted against rental income for individual landlords; it is a basic-rate tax credit. This means the pre-tax break-even figure understates the true occupancy floor for higher-rate taxpayers. The rule of thumb is to add 10–15 percentage points to break-even for a higher-rate landlord on a mortgaged BTL. Limited-company structures (SPVs) preserve full interest deduction and often recover much of that margin. HMRC'sProperty Income Manualis the authoritative reference for how expenses are treated.
Canada
In Canada, the interaction between thestress test(currently the greater of contract rate + 2% or 5.25%) and the elimination of the principal residence exemption for pure investment properties means Canadian landlords must model both a payment shock and CRA reporting requirements. The Bank of Canada'sFinancial Stability Reviewtracks investor-share of new mortgages closely. Provincial rent controls (Ontario, BC, Quebec) can also freeze rent growth well below inflation, so Canadian landlords should stress a scenario where GPR grows 0% for three years.
Australia
Australian landlords benefit fromnegative gearing: net rental losses can offset other taxable income, cushioning the after-tax pain of a fragile break-even. But the pre-tax number still matters for cash flow and refinancing. Land tax thresholds differ by state (Victoria's was cut sharply in 2024, pulling many previously untaxed BTLs into scope), and short-let regulation is now active in NSW and Victoria. The Australian Bureau of Statistics publishesofficial rent-price datauseful for GPR calibration.
The UAE has no personal income tax on rental income, which structurally lowers break-even for the same physical property compared with any other Tier-1 market. But service charges are high (AED 12–25/sqft is normal in prime Dubai buildings), mortgage LTVs are capped by the Central Bank at 80% for residents and 75% for non-residents on the first property, and short-let regulation in Dubai requires a DET permit and payment of the tourism dirham. Abu Dhabi's rules differ from Dubai's. Verify with the Dubai Land Department or the relevant emirate authority before finalising numbers.
Cross-border landlords
If you invest across borders, withholding tax, double-taxation treaties, and currency-hedging costs all silently raise your break-even. Model FX at a 5% adverse move to your home currency and add any withholding to your fixed costs. A UK-resident landlord holding a Dubai flat is exposed to AED/GBP volatility on every payment cycle.
Sensitivity and stress tests: making break-even resilient
A single break-even number is a snapshot. It answers the question, "given today's numbers, how much vacancy can I absorb?" But the numbers rarely stay still. Interest rates reset, insurance premiums climb, HOA boards vote fees up, taxes get reassessed, and markets soften. A resilient landlord doesn't just calculate one break-even — they build a small matrix that shows how break-even moves under adverse conditions. This is called a sensitivity table, and institutional buyers of income real estate have been building them for fifty years.
The two-variable sensitivity table
Pick the two variables that most affect your break-even. For most landlords, that is the mortgage rate and the gross potential rent. Build a 5×5 grid: rate on one axis, rent on the other, with break-even occupancy in each cell. Here is what that looks like for the Austin condo from earlier, if the buyer negotiates to $370,000 and puts 30% down.
Break-even occupancy grid — Austin condo at $370,000, 30% down
Two things become immediately obvious. First, the deal only becomes plausibly resilient (break-even below ~85%) at the top-right corner of the grid — either the rent has to be at the very top of the comp range, or the rate has to be materially lower than current market. Second, break-even is highly sensitive to rent: a $200 increment in monthly rent shifts break-even by 7–10 points, more than a full percentage point in mortgage rate. This is a specific, actionable insight — the marginal dollar of effort is better spent on the rental strategy than on shopping for a slightly cheaper mortgage.
The three-scenario stress test
If a full sensitivity table is more than you want to build, use a lighter three-scenario version:
Simple three-scenario stress test template
Break-even at least 10 pts below realistic occupancy
Property still covers fixed costs at some occupancy under 100%
If a deal fails the Severe test, it doesn't automatically mean don't buy — the odds of Severe are lower — but it means you should size the deal small enough within your portfolio that a Severe outcome is survivable. This is exactly how the Bank of England's macroprudential stress-test framework thinks about mortgage risk at the system level, and there is no reason an individual landlord should reason less rigorously about their own balance sheet.
Why break-even beats DSCR for single-property landlords
Debt service coverage ratio is the equivalent metric commercial lenders use. DSCR = NOI ÷ debt service. It is mathematically equivalent to break-even occupancy for a given expense ratio, but expressed as a coverage multiple rather than a percentage. Commercial underwriters like DSCR because it plugs straight into loan covenants ("maintain DSCR ≥ 1.20"). Individual landlords should prefer break-even occupancy for two reasons: it is expressed in units (percent occupied) that map directly to observable market data (vacancy rates), and it doesn't hide the expense ratio, which is where many small residential deals actually die.
Financing structure and its outsized effect on break-even
Two identical properties in the same building, bought for the same price, can have wildly different break-even numbers depending purely on how they are financed. This is the leverage effect, and it is the single lever that most first-time landlords underestimate.
Loan-to-value (LTV)
Every percentage point of LTV you reduce translates directly into a lower monthly payment and a lower break-even. On a $400,000 property at 6.75% over 30 years, moving from 80% LTV to 60% LTV drops the monthly payment from $2,076 to $1,557 — a $519/month reduction that, at a $2,600 gross potential rent, pulls break-even down by roughly 20 percentage points. This is why cash-heavy landlords consistently show more resilient portfolios in cycle downturns: their fixed costs simply start lower.
Amortisation period
A 30-year amortisation produces a lower monthly payment (and therefore lower break-even) than a 20- or 25-year loan, but at the cost of slower principal build-up. From a pure break-even perspective, the longer amortisation is more resilient. From a wealth-building perspective, the shorter amortisation compounds equity faster. Most Tier-1 landlord strategies favour longer amortisation for cash-flow safety, then use surplus rent to accelerate principal paydown voluntarily — the reverse of what many first-time buyers do.
Interest-only vs. amortising
Interest-only loans are common in the UK BTL market and, more selectively, for professional US and Australian investors. They lower the current monthly payment (and current break-even) but do not build equity, and they concentrate all repayment risk at maturity. As demonstrated in theManchester example above, they also amplify break-even sensitivity to rate movements. Our companion guide oninterest-only mortgagesunpacks the math and the risk-management approach in depth.
Fixed vs. variable
A fixed-rate loan lets you lock in break-even for the fixed term. A variable-rate loan means break-even floats. The right choice depends less on rate forecasts (rate forecasts are notoriously unreliable) and more on your own capacity to absorb break-even variability. Landlords with one or two properties usually should prefer fixed rates for the entire hold period they can arrange; portfolio landlords with cash buffers can tolerate variable exposure more comfortably.
Currency of financing
An overlooked factor for cross-border landlords. If you buy a property in Dubai (income in AED) but finance it in another currency, you have opened an FX exposure equal to the outstanding loan balance. In an adverse FX move, your debt service in home-currency terms rises, but your rent in home-currency terms falls. This is a rare but catastrophic driver of break-even blowouts. The safest default is to finance in the same currency as the rent.
Financing structure heuristic
All else equal, prefer: lower LTV over higher, longer amortisation over shorter, fixed over variable for concentrated portfolios, same-currency over cross-currency, and repayment over interest-only for buyers with limited liquidity outside the property.
Seasonality, ADR volatility and the short-let-specific gotchas
The short-let version of break-even occupancy has one property that makes it fundamentally harder than the long-let version:revenue is not evenly distributed across the year. A Dubai short-let earns 60% of its annual revenue in five months. A Toronto short-let earns 55% of its annual revenue in four. An Edinburgh flat earns nearly a third of its annual revenue during the August festival month. Break-even occupancy computed on annual averages will hide precisely the periods when the property is most likely to fail.
Month-level break-even
For any short-let, always compute break-even at the monthly level, using the specific month's expected ADR and expected occupancy. A property with a defensible annual average of 68% occupancy at $200 ADR may actually show three months where the achievable ADR drops to $110 and occupancy to 45% — the low season. If the fixed cost stack doesn't move much (mortgage, HOA, insurance are month-invariant), those months can be far below the annual break-even, meaning the property is losing money on a run-rate basis for a third of the calendar even though the annualised numbers look healthy.
Cash-flow timing
This has practical cash-flow implications. If a landlord is running month-by-month, they need to be sure the peak-season surplus is set aside (not spent) to fund the low-season deficit. In practice, novice short-let operators frequently spend peak-season cash on renovations or personal draws and then run into liquidity pressure in the off-season. The fix is disciplined: at the start of each year, project the twelve monthly break-even calculations, sum the projected surpluses and deficits, and ring-fence the surplus months.
Regulatory shock is a seasonal event
Short-let regulation has tightened sharply in most Tier-1 cities since 2020. New York City effectively banned de-facto short-lets in September 2023 under Local Law 18. London imposed a 90-night annual cap in 2015 that is now being enforced more aggressively. Barcelona announced a full phase-out of short-let licences by 2028. Sydney requires 180-day host-not-present caps in Greater Sydney. Toronto's principal-residence rule limits short-let to the operator's primary home. In each of these cases, regulatory shocks arrived without warning and shifted realistic short-let occupancy by 20–40 points overnight. A landlord whose break-even calculation assumed the pre-regulation regime was immediately underwater.
The defensive practice is straightforward: for every short-let deal, compute a second break-even that assumes a switch to long-let use — because if regulation tightens, that is the fallback. If the long-let break-even is fragile too, the deal has no escape hatch.
Regulation is not stress; it is structural
Do not treat short-let regulation as a low-probability tail risk. Treat it as a base-case scenario over any 5–10 year hold. The specific rules that will apply are uncertain; the direction of travel — tighter — is not.
Common mistakes and myths
1. Using teaser rates instead of reset rates
The single most common error. A landlord on a 2-year fixed at 3.4% who computes break-even at 3.4% is not stress-testing — they are describing the honeymoon period. Always compute at the higher of your reset scenario or the current market rate.
2. Assuming 100% occupancy is achievable
Even in the tightest rental market, some vacancy is structural: tenant turnover, minor renovations, seasonal soft weeks. Long-let occupancy tops out around 96–97% over the long run. Short-let occupancy above 80% is exceptional and usually only sustained by aggressive discounting that pulls ADR down.
3. Forgetting the reserve
A property that is never maintained becomes unrentable. Every landlord who omits a reserve line is borrowing from future capex to hit their current break-even. Two boiler replacements or one major roof event can wipe out a decade of thin margin.
4. Confusing yield with resilience
A 10% gross yield with break-even at 95% is a fragile deal. A 6% gross yield with break-even at 65% is a resilient one. The market often prices these two profiles closer than the resilience gap warrants.
5. Ignoring HOA or service-charge inflation
US condo HOAs and Dubai service charges are landlord-side inflation risks that don't respond to the wider inflation environment — buildings age, reserve deficits emerge, and boards vote fees up. Model 5% annual growth minimum on any managed building.
6. Treating short-let occupancy the same as long-let
Short-let occupancy is measured differently by every data provider (booked vs. available, calendar-day vs. bookable-day). Always confirm which basis your source uses before treating a 65% figure as directly comparable with a long-let 95%.
7. Skipping tax-driven adjustments
Especially in the UK (Section 24), Canada (principal residence rules), and Australia (land tax thresholds). A pre-tax break-even can look fine while the after-tax picture is materially worse.
8. Not re-running the number annually
Break-even is not a one-time exercise. Insurance, tax, HOA and interest all move. Once a year, rebuild the calculation with current numbers. A property that was resilient in 2022 might be marginal in 2026.
How break-even occupancy connects to other property metrics
Break-even occupancy is not a substitute for other metrics — it is their stress test. Here is how it slots into a fuller landlord dashboard.
Where break-even occupancy sits alongside other key metrics
Ignores financing; break-even reveals leverage sensitivity
Levered annual cash return on invested equity
Positive CoC requires occupancy above break-even
Yield tells reward; break-even tells fragility
Cash flow is positive only above break-even
Higher IO share amplifies break-even swings
The right mental model is a pyramid. Cap rate and yield tell you whether the asset is priced reasonably. Break-even occupancy tells you whether it survives adverse conditions. Cash-on-cash and DSCR tell you the return profile above the survival threshold. Skipping any layer means you're solving the wrong problem.
See our companion pieces oncap rate vs. cash flowandcalculating cash-on-cash return properlyfor the fuller framework.
Portfolio-level break-even: from one property to many
Landlords who own more than one property need a second, portfolio-level break-even. The math is the same — sum fixed costs across the portfolio, sum gross potential rent across the portfolio, divide — but the interpretation is subtly different.
Diversification of vacancy
A single-property landlord who suffers a two-month vacancy on their only property loses 17% of their annual rent that year. A ten-property landlord suffering a two-month vacancy on one unit loses 1.7% of annual rent. Portfolio break-even can therefore be tighter than single-property break-even without introducing the same fragility, because vacancy events across independent units are (approximately) uncorrelated. This is the primary financial reason portfolios of small residential units often outperform single trophy assets on a risk-adjusted basis.
Correlated risks
But some risksarecorrelated across a portfolio: a citywide interest-rate reset hits every mortgage; a citywide short-let regulation hits every short-let; a local employer closing hits every property in the neighbourhood. Portfolio break-even resilience is only as strong as the correlation structure of your holdings. A portfolio of ten flats in the same building has almost no diversification against building-level, city-level, or regulatory risk.
The portfolio break-even table
The recommended quarterly practice is to maintain a simple portfolio table with one row per property and columns for: current break-even occupancy, current realistic occupancy, safety margin, next scheduled rate reset, and the largest single upcoming cost event (tax reassessment, HOA review). Sorted by safety margin ascending, the top rows are your action list.
Illustrative four-property portfolio dashboard
Three of the four properties are in trouble. Only the Brisbane townhouse is resilient. A landlord who ran this table quarterly would have known that months in advance, and had time to refinance, raise rent, sell, or shift strategy. A landlord who tracks only aggregate net rental income would find out too late.
Running the numbers with free calculators
Once you understand the formula, you don't want to spread-sheet a break-even calculation from scratch every time you see a new listing. That's what our free calculator suite is for.
Break-Even Occupancy Calculator
Enter fixed costs and expected rent; the tool returns break-even occupancy for long-let and short-let modes.
Model monthly and annual cash flow at any occupancy above break-even, including tax treatment.
Short-Let Income Calculator
Estimate short-let revenue with ADR, occupancy, cleaning fees and platform commissions built in.
Compute gross and net rental yield to compare deals across cities and countries.
Our recommended sequence is: use therental yield calculatorto filter deals into a shortlist, run each survivor through thebreak-even occupancy calculatorto check resilience, and then use thecash-flow calculatorto model returns above the floor. For a short-let, drop in theshort-let income calculatorto test how much of your rent depends on peak-season pricing.
Landlord break-even checklist
Use this before every purchase and at every mortgage anniversary:
- Listed every fixed monthly cost, including HOA, reserve and compliance
- Used current (or reset) interest rate — not the teaser rate
- Used comparable-based gross potential rent, not asking rent
- Separated variable costs (short-let: cleaning, utilities, fees) if applicable
- Computed break-even occupancy as a percentage
- Compared to realistic long-run submarket occupancy
- Verified the safety margin is ≥10 points (long-let) or ≥15 points (short-let)
- Stress-tested with +200bps interest, +5% HOA and −5% rent
- Modelled the tax treatment specific to your jurisdiction
- Documented the assumptions so you can re-run next year
Run your break-even number now
Enter your fixed costs and rent into the LashkariProperties break-even occupancy calculator and see your safety margin instantly. Then compare the shortlist with our cash flow and rental yield tools.
Open break-even calculatorSee all tools
Frequently asked questions
What is break-even occupancy in rental property?
Break-even occupancy is the minimum percentage of time a rental must be occupied at market rent for income to cover fixed costs — mortgage, taxes, insurance, HOA and reserves. Below this floor, the property loses money each month.
What is a good break-even occupancy for a long-term rental?
Most investors target a break-even of 75% or lower on a long-let. Typical Tier-1 long-let vacancy is 3–8%, so a 75% break-even leaves a comfortable safety margin. The larger the gap between break-even and realistic occupancy, the more resilient the deal.
How is short-let break-even occupancy different?
Short-let break-even uses average daily rate multiplied by nights as gross potential rent, and includes cleaning, platform fees and utilities as variable costs. Because short-let revenue is more volatile, investors demand a wider gap — usually at least 15 percentage points between break-even and market occupancy.
Does break-even occupancy include vacancy?
No. Break-even occupancy is the vacancy limit itself. It answers the question: how high can vacancy get before I start losing money? Compare it to expected market vacancy to judge safety margin.
How do interest rates affect break-even occupancy?
Higher interest rates raise the fixed-cost numerator, pushing break-even occupancy up. A 1-percentage-point rate rise on a 25-year mortgage can lift break-even by 5–10 percentage points, which is often the difference between a resilient deal and a fragile one.
Should I use gross rent or net rent to calculate break-even occupancy?
Use gross potential rent — the market rent at 100% occupancy — as the denominator, and treat occupancy-driven costs (management, cleaning, utilities) as fixed or variable operating costs. This keeps the ratio comparable across properties.
What is the difference between break-even occupancy and break-even ratio?
Break-even ratio (BER), common in commercial real estate, equals total operating expenses plus debt service divided by gross potential income. Break-even occupancy expresses the same idea as a percentage of time occupied. For most residential landlords they produce identical answers.
How do I calculate break-even occupancy for an Airbnb?
Sum fixed monthly costs, divide by ADR times nights in the month. If your ADR is $200 and total monthly fixed costs are $3,600, break-even occupancy is 3,600 / (200 × 30) = 60%. Compare to your submarket's realistic short-let occupancy before buying.
How does break-even occupancy relate to cash flow and rental yield?
Break-even occupancy is a stress test; cash flow is the outcome above the floor; rental yield is the same relationship expressed as annual return on price. A property with strong yield but a break-even of 90% is still fragile — a small vacancy or rate move wipes out cash flow.
Yes, and it means the property cannot cover fixed costs even at full occupancy at market rent. This is common at low cap rates and high leverage. The only fixes are lower price, more equity, cheaper financing, higher rent, or a different use of the property.
How often should I recalculate break-even occupancy?
Recalculate at every major event: mortgage renewal or rate reset, insurance renewal, HOA increase, property tax reassessment, or rent review. On a fixed-rate loan, once a year is usually enough.
Indirectly. Commercial and DSCR lenders test debt service coverage ratio (DSCR), which is mathematically related. A DSCR of 1.20 typically implies a break-even occupancy near 83%. Residential lenders usually apply a stressed rental income assumption rather than an explicit break-even test.
Conclusion and next steps
The value of break-even occupancy is that it collapses everything a landlord worries about — mortgage rate, taxes, HOA, insurance, vacancy, cleaning, platform fees — into a single number a normal human can compare across deals. It is the closest thing residential landlords have to the discipline that commercial investors take for granted.
Three things to do next:
- Run your current portfolio through the number.If you already own rentals, compute break-even for each at today's mortgage rate. Anything above 85% for a long-let or 75% for a short-let is a portfolio-level risk that deserves a plan.
- Bake it into your buying process.Alongside price, yield and neighbourhood, add "break-even occupancy" and "safety margin" as mandatory fields on your shortlisting spreadsheet.
- Re-run it annually.Set a calendar reminder. Insurance, tax and HOA all creep. What was resilient one year may be fragile the next.
Read next:Cap Rate vs Cash Flow — Which Metric Should Guide Your Decision?andDSCR Explained — The Investor Loan Metric That Matters. And when you are ready to run your own numbers, thebreak-even occupancy calculatortakes about ninety seconds.
This article is educational and general in nature. It does not constitute personalised financial, tax, legal or investment advice. Rules and rates differ by country, state, province, city and personal circumstance. Verify any figures with a qualified local professional before making a purchase, refinance, tax or letting decision. Historical performance does not guarantee future results.
Tools mentioned in this article
Related reading
- Cash-on-Cash Return: How to Calculate It Properly
Learn how to calculate cash-on-cash return correctly with clear formulas, worked examples with and without leverage, common mistakes to avoid, and a step-by-step framework for property investors in the USA, UK, Canada, A
- How to Calculate ROI on a Rental Property — The Complete 2026 Investor Guide
Learn how to calculate ROI on a rental property the right way. Total ROI vs cash-on-cash, hidden costs most investors forget, worked examples for USA, UK, Canada, Australia and UAE — plus free calculators.
- Price-to-Rent Ratio: What It Signals About Rent vs Buy Markets
Learn what the price-to-rent ratio really tells you about a housing market, how it differs across Tier-1 cities (US, UK, Canada, Australia, UAE), and how to combine it with a personal rent-vs-buy calculation before you b