
Investment Guides
Short-Let vs Long-Let Income: How to Compare Fairly
By Imran Lashkari · August 6, 2026 · 29 min read

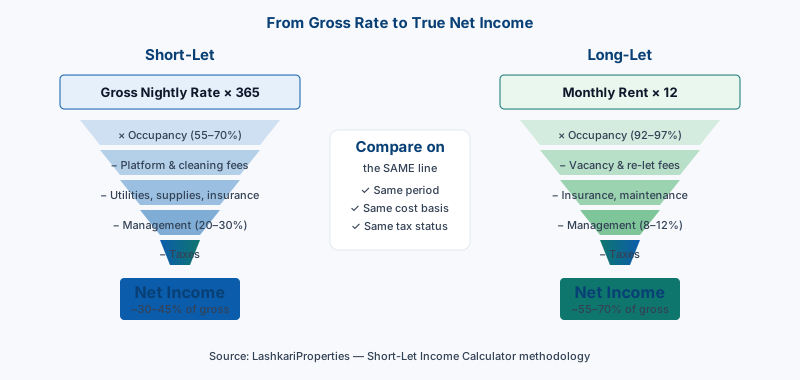
A landlord in Manchester tells you her one-bed apartment earns "£180 a night on Airbnb". A landlord in the same building rents an identical unit for "£1,300 a month". On paper, the short-let looks like a giant. Multiply £180 by 365 and you get £65,700 a year — five times the long-let's £15,600. The story writes itself, and it is wrong.
By the time you strip out the nights that were never booked, the platform's cut, the cleaner's fee for every changeover, the wear and tear, the toilet paper, the licences, the co-host, the accountant and the tax office, the short-let often ends up delivering a net income only 10–40% higher than the long-let — for two to three times the operational effort and a materially higher regulatory risk. In some Tier-1 markets in 2026, after new licensing rules, it delivers less.
This guide gives you the exact method used by professional analysts to compareshort-let vs long-let incomefairly. You will learn the formulas, the traps, the numbers to trust and the numbers to discount, and you will walk away with a repeatable process — plus free calculators onLashkariProperties— that you can apply to a real property this week.
The stakes are not academic. Getting the comparison wrong at the buying stage can push you into a mortgage product priced for the wrong strategy, into a licence category you did not qualify for, or into a cash-flow trap two winters after purchase when the tourist tide goes out. Getting it right buys you optionality: the ability to switch, hybridise, or hold with equal confidence. That optionality is worth more, in a 2026 Tier-1 property market where regulation is tightening and platform economics are maturing, than the extra few percent of yield the naive comparison promises.
We will move deliberately from vocabulary to formulas, from formulas to worked examples across three continents, from examples to Tier-1 regulatory nuance, and from nuance to a checklist you can print. Along the way we will lean on primary sources — HMRC guidance, city licensing registries, central-bank housing data — rather than the marketing pages of platforms or listing sites. The goal is a model you would defend to a lender or a partner, not a model that flatters the property you already fell in love with.
By the end of this article you will (1) build a like-for-like net operating income comparison for any property, (2) know the break-even occupancy your short-let must clear to beat a long-let, (3) understand how Tier-1 rules in the USA, UK, Canada, Australia and UAE change the answer, and (4) stress-test both strategies for regulation, seasonality and demand shocks.
Key definitions and formulas
Before we can compare anything, we need shared vocabulary. Analysts and agents use these terms loosely; investors cannot afford to. Get the definitions crisp and the comparison writes itself.
Core revenue metrics
- ADR (Average Daily Rate)— total room revenue divided by nights booked. This is yournetnightly price, after any discounts the platform applied but before fees.
- Occupancy Rate— nights booked divided by nights available. For a short-let, 365 nights are theoretically available; realistic Tier-1 city occupancy is 55–70% annually.
- RevPAR (Revenue Per Available Room)— ADR × Occupancy. This, not ADR, is the correct top-line to compare with a long-let's monthly rent × 12.
- Gross Long-Let Revenue— advertised monthly rent × 12 × (1 − vacancy rate). Vacancy is usually 3–8% in Tier-1 markets.
Cost and profit metrics
- Operating Expenses (OpEx)— everything that keeps the property running: platform fees, cleaning, utilities, supplies, insurance, management, licences, subscriptions, and maintenance. Excludes financing and income tax.
- Net Operating Income (NOI)— Gross Revenue − OpEx. This is the correct number to compare between strategies. It isnotthe same as cash flow.
- Net Cash Flow— NOI − mortgage interest − principal − income tax. This is what actually lands in your bank account.
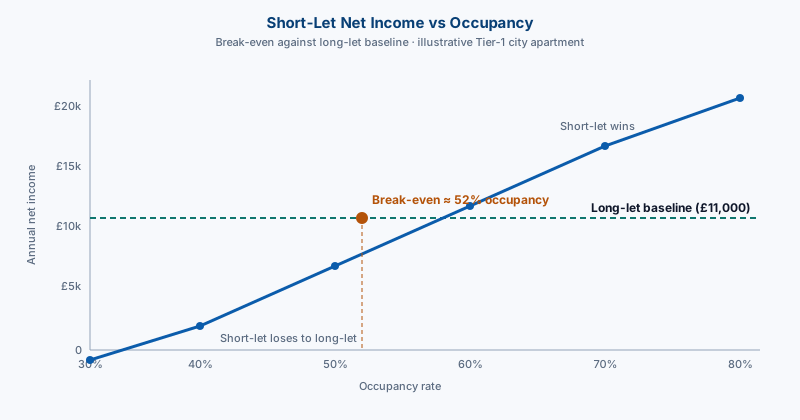
- Break-Even Occupancy— the minimum short-let occupancy that produces the same NOI as the equivalent long-let. If you cannot confidently exceed this occupancy in a bad year, the long-let is the safer bet.
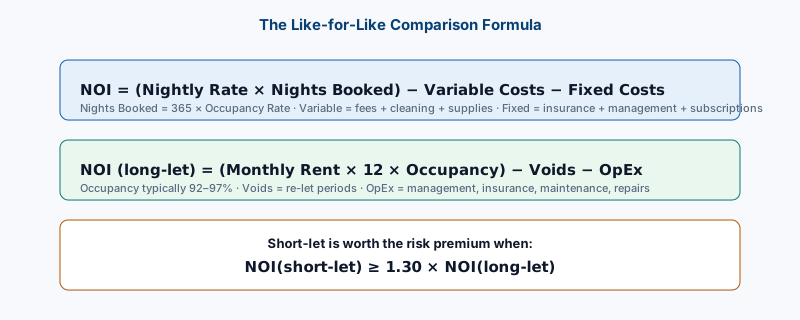
NOI(short-let) = (ADR × 365 × Occupancy) − Variable Costs − Fixed Costs NOI(long-let) = (Monthly Rent × 12 × (1 − Vacancy)) − OpEx Fair test : NOI(short-let) ≥ 1.30 × NOI(long-let)
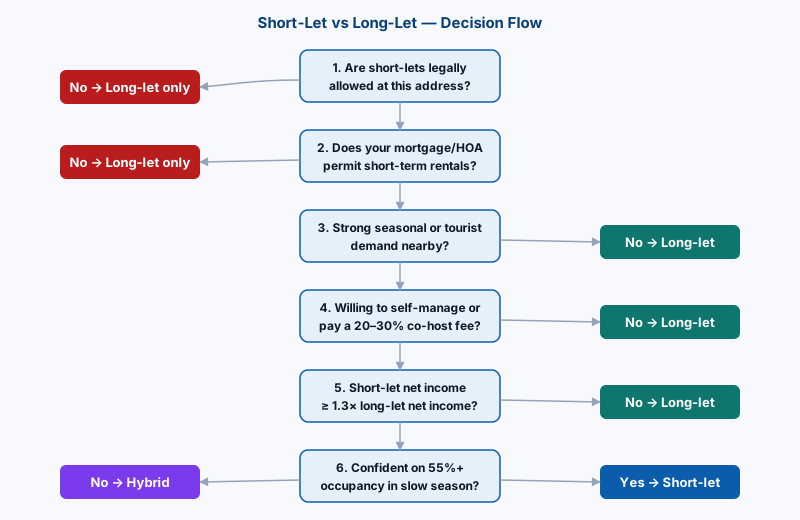
The 1.30× factor is a risk premium. Short-lets have higher revenue volatility, higher regulatory sensitivity, higher management workload and higher wear-and-tear. Requiring 30% more net income is a defensible threshold used by hospitality analysts to price that additional risk. Some investors demand 1.50× in tightly regulated cities; others accept 1.15× in tourist hotspots. Pick your factor and be consistent.
"Compare on the same line: same 12-month window, same cost basis, same tax status. Anything else is storytelling, not analysis."
Why this comparison matters for buyers, investors and landlords
For buyers considering an investment purchase
The strategy you choose changes the price you should pay. A property that models well as a short-let can support a higher purchase price because the debt-service coverage is stronger — but only if the underwriting assumes conservative occupancy. Overpaying at peak short-let numbers and then being forced by regulation to convert to a long-let is one of the most common ways new investors lose money in 2026.
For existing landlords deciding whether to convert
Converting a long-let to a short-let is easy on a spreadsheet and hard in real life. You will need furniture (£8,000–£25,000 depending on size and market), a licence in most Tier-1 cities, a different insurance policy, a professional cleaning rota, and either 20+ hours a month of your own time or a co-host taking 20–30% of gross. Modelling the switch fairly tells you whether the incremental net income is worth the incremental workload and risk.
For mortgage-holders and refinancers
Lenders in the USA, UK, Canada and Australia increasingly ask whether a property is a short-let, and price the loan accordingly. DSCR products for short-lets often carry 25–75 basis points higher rates than long-let equivalents, and some lenders cap loan-to-value at 65–70% for short-lets. A fair comparison keeps you honest with your lender and your own risk budget. See our companion guide onDSCR explained for investorsfor the underwriting mechanics.
For renters and accidental landlords
If you inherit a property, relocate temporarily, or need to leave a home for a year, the same math tells you whether to short-let it, long-let it, or sell. In many Tier-1 cities today, the answer for a single accidental unit — with no time to build reviews, no professional cleaner on retainer, and no licensing — is almost always long-let.
For portfolio landlords considering a strategy shift
Investors who already own several long-lets often flirt with short-let conversion after seeing a single strong headline number from a competitor. The fair comparison is what protects a portfolio from a bad conversion. Converting even one high-value unit means capital outlay of £8,000–£25,000 in furniture and setup, a redirected 20–40 hours a month of operator attention, and a re-underwriting of the debt if the lender is notified. If the resulting NOI uplift does not clear the 1.30× threshold, the portfolio dollar was better spent buying the next long-let outright.
Industry data from AirDNA, STR and city licensing registries consistently shows the top 10% of short-let hosts in a market capture 40–60% of the profit. The median short-let, run part-time by an individual owner, often underperforms a competently managed long-let after year two, when reviews plateau and maintenance kicks in.
The 6-step comparison method
Every fair comparison follows the same six steps. Skip one and the whole model tilts. If you use theShort-Let Income Calculatorand theRental Yield Calculatortogether, they will walk you through this workflow automatically — but understanding the steps by hand is what turns a template into a decision-making tool.
Step 1 — Verify the property is legally eligible
Before you touch a number, confirm three things: is short-letting allowed by local law at this address; does the mortgage or lease permit it; and does any HOA, strata, condo board or freeholder allow it? A yes on all three is required. A no on any one collapses the comparison — you are looking at a long-let regardless of the math. In New York City, London, Vancouver and Sydney this step alone changes the answer for tens of thousands of properties.
Step 2 — Pull comparable market rates from three sources
Do not use the seller's or agent's numbers. Instead, pull:
- Long-let comparable rent— three currently advertised units on Rightmove/Zillow/Domain/Bayut within 500 m, same size, similar condition.
- Short-let ADR and occupancy— three active listings on Airbnb/Vrbo/Booking within 1 km, plus a subscription or free-tier check of a market-data provider (AirDNA, MashVisor, KeyData). Take medians, not averages, to avoid outliers.
- Seasonality curve— twelve monthly ADR points, not one annual figure. This exposes whether your rate is being propped up by two peak months.
Step 3 — Model revenue on the same 12-month window
Both strategies must be projected over the exact same year. A common trap is quoting a short-let's summer rate against a long-let's whole-year rent. Instead, build:
Short-Let Gross Revenue = Σ (ADR_month × Nights_available × Occupancy_month) for 12 months Long-Let Gross Revenue = Monthly Rent × 12 × (1 − Vacancy)
Summing month-by-month is important because Tier-1 markets can swing from 85% occupancy in July to 35% in February. A blended annual occupancy of 60% hides that seasonality risk.
Step 4 — Deduct every operating cost, in the same categories, for both
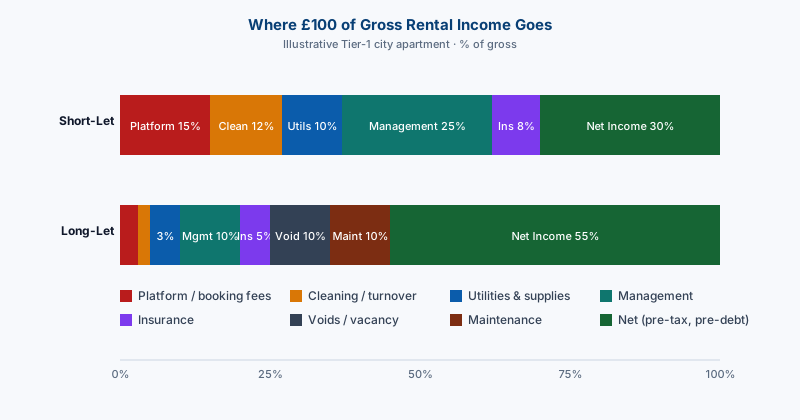
Analysts miss costs because the categories look different between strategies. The trick is to force them into the same buckets:
Cost buckets: how short-let and long-let expenses map onto each other
Airbnb/Vrbo host fee 3–5%; Booking.com 15–17%
Letting agent tenant-find 4–8% of first year
Full-service co-host 20–30% of gross bookings
Cleaning £30–£90 per stay (often passed to guest)
Linen, toiletries, coffee, batteries: £40–£120/month
Specialist short-let cover 30–60% higher than standard
Local licence, safety certificates, tourist tax registration
Landlord registration (varies by jurisdiction)
Typically 3–8% of the year between tenants
Step 5 — Apply taxes and financing to reach net cash flow
NOI is where the operational comparison ends. But investors spend cash flow, not NOI. Layer in mortgage interest, principal repayment (a balance-sheet item, not a P&L item, but it moves cash), and income tax at your marginal rate. For short-lets you may also owe transient occupancy tax, VAT/GST (once you cross thresholds), and in some jurisdictions business rates instead of council tax.
Step 6 — Stress-test with three scenarios
A single-number comparison is a story. A stress-tested comparison is analysis. Always run:
- Base case— median ADR × median occupancy × median costs.
- Downside— ADR −15%, occupancy −15 percentage points, costs +10%.
- Regulation shock— a 90-night cap (London, Amsterdam-style) or full ban on unhosted stays (NYC-style).
If your short-let still beats your long-let by ≥ 1.30× in the downside case, the strategy is robust. If it wins in the base case but breaks in the downside, you are underwriting a good market — not a good property.
The three scenarios are not paranoia. In 2020 the pandemic delivered an occupancy shock deeper than the downside case above. In 2023–2024 New York City, Barcelona, Amsterdam and multiple Australian councils delivered regulation shocks harsher than the third case above. In 2025 the UK abolished the FHL regime — a tax shock most models had not priced in. A serious underwriting acknowledges that at least one such event is likely across any ten-year hold. If you cannot articulate what would happen to your property if a similar shock landed in year three, you are not ready to buy.
Sensitivity, not certainty
Do not aim for a single "right" answer. Aim for a tight, defensible range: base NOI, downside NOI, and the specific ADR/occupancy combination at which each strategy overtakes the other. This range — not a single point estimate — is what belongs in your investment memo.
Worked numerical examples
Three worked examples across the USA, UK and UAE. All numbers are illustrative for 2026 and internally consistent — do not use them as market forecasts. Local variance is enormous; verify with the calculators listed under"Run the numbers".
Example 1 — Austin, Texas: 1-bed condo near downtown
Purchase price $420,000. Long-let market rent $2,150/month. Short-let ADR $185, market occupancy 62%.
Austin, TX — annual comparison (USD, illustrative 2026)
The Austin case is deliberately close. At 62% occupancy and 25% co-host fees, the two strategies deliver near-identical NOI. The short-let has more upside if the operator can push occupancy to 70% and self-manage, but the long-let wins on effort, volatility and financing cost. This is the situation where the 1.30× risk-premium rule matters most: even if short-let NOI matches long-let NOI, that is not enough — you need materially more to compensate for the extra work and risk.
Example 2 — Manchester, UK: 1-bed city-centre apartment
Purchase price £215,000. Long-let market rent £1,300/month. Short-let ADR £128, market occupancy 63%.
Manchester, UK — annual comparison (GBP, illustrative 2026)
Manchester's short-let scene is competitive; ADR is capped by supply. At a 1.06× ratio the short-let fails the 1.30× fair-test — the extra £737 of NOI does not compensate for the extra workload, higher wear and regulatory drift. If the London 90-night cap ever extends to Greater Manchester, the short-let's NOI drops to roughly £6,400, and the long-let wins outright by 90%.
Example 3 — Dubai Marina, UAE: 1-bed apartment
Purchase price AED 1.45 million. Long-let market rent AED 92,000/year. Short-let ADR AED 520, market occupancy 68%.
Dubai Marina — annual comparison (AED, illustrative 2026)
Dubai's headline short-let numbers are compelling until you deduct the DTCM permit, the tourism dirham, the DEWA and chiller costs that landlords absorb, and the 22% short-let management fees typical for the Marina. The long-let wins by a wide margin at these inputs — but the numbers tilt in favour of short-let if you self-manage, own outright (no mortgage), and can hold 70%+ occupancy through summer.
Across our three examples, the short-let never won by 30%. That is not a coincidence: mature Tier-1 markets have priced short-let demand into ADR while cost inflation, regulation and management fees have eroded the gross-to-net gap. The rule "short-let ≥ 1.30 × long-let" is set exactly here — at the threshold where the extra risk is genuinely worth it.
Cross-example lessons
Three deliberate lessons emerge from the Austin, Manchester and Dubai cases:
- Management fees compress the win.In every example, the co-host or property manager captured the largest single share of the short-let's gross-to-net delta. If you cannot self-manage, the short-let must run at materially higher occupancy just to hold the line.
- Landlord-paid utilities are quietly punishing.In Dubai the DEWA and chiller bill approaches AED 14,400 a year on a 1-bedroom; in Manchester council tax, utilities and internet together approach £3,200. The long-let sheds these entirely — tenants pay directly.
- Regulation is not a footnote.A permit or licence line item of a few hundred units of currency is trivial; a night-cap that halves occupancy is not. Two of our examples would flip decisively if a night-cap were imposed.
What the hybrid model actually looks like
A fourth option deserves attention: the hybrid strategy, where the property runs as a short-let during high-demand months and a medium-term let (30–180 nights, corporate or relocation tenants) in the rest. In practice this looks like a 90-night summer short-let in Edinburgh at high ADR, followed by a 9-month furnished corporate let at 85–90% of standard long-let rent. Hybrid returns can sit 10–25% above a pure long-let with materially less regulatory exposure than a pure short-let. The trade-off is complexity — you are now running two businesses on one asset, with two sets of insurance, contracts and marketing. Model it as its own scenario, not as a rescue plan for a failing short-let.
Tier-1 market nuances
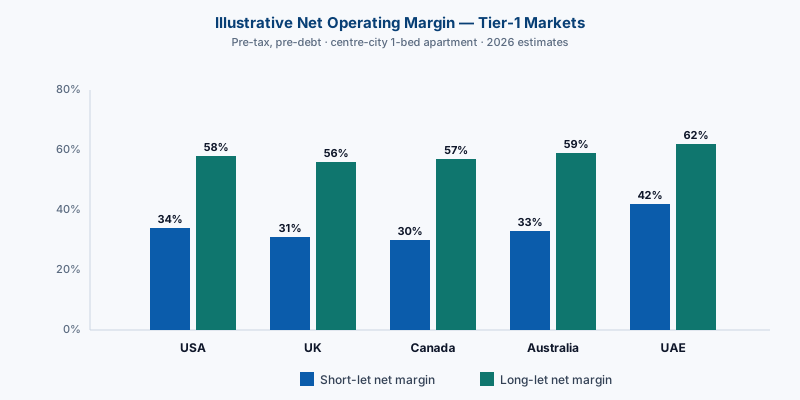
The US is a patchwork of city-level rules. Nashville, Miami and Scottsdale still support strong short-let economics; New York City effectively banned unhosted stays under 30 days via Local Law 18 in 2023, and enforcement has intensified through 2026. State-level 1099-K reporting from platforms is now standard, and many hosts are exposed to hotel occupancy tax collection at the city, county and state level simultaneously. On the long-let side, rent-control expansion in California, Oregon and parts of New York constrains rent growth but improves tenant stability. For financing, most US lenders will underwrite a short-let with DSCR products at 25–50 bps higher than conforming long-let loans; see the mechanics in ourDSCR guide.
The UK's furnished holiday let (FHL) regime — long a tax-favoured status — was abolished by HMRC from 6 April 2025, and short-let profits are now taxed under standard property income rules with no capital-allowance shelter for new investments. London is capped at 90 nights per calendar year for unregistered short lets under the Deregulation Act 2015, enforced increasingly via platform data-sharing agreements. Scotland requires a short-term let licence in every local authority. Wales has implemented council-tax premiums for second homes and short-lets up to 300%. For long-lets, the Renters' Rights Bill's abolition of Section 21 changes the eviction landscape but not the income math directly. SeeHMRC's property income manualfor definitions.
Canada
Canada's short-let landscape hardened between 2023 and 2026. Federal budget measures denied income-tax deductions for non-compliant short-term rentals, and provincial and municipal rules now require registration in Vancouver, Toronto, Ottawa, Montreal, Halifax and beyond. Vancouver's principal-residence requirement means most non-owner-occupied condos cannot legally short-let at all. On the long-let side, provincial rent controls in British Columbia and Ontario keep rent growth predictable but modest — favouring holding for capital growth rather than income growth. TheCanada Revenue Agencypublishes current guidance on rental-income reporting.
Australia
Australia's state-by-state approach means Sydney short-lets are limited to 180 nights per year for non-hosted stays; Victoria introduced a 7.5% short-stay levy in 2025; and Byron Bay caps non-hosted lets at 60 nights per year. Coastal tourist markets — Gold Coast, Sunshine Coast, Margaret River — often show the strongest short-let-to-long-let net-margin gap in the Tier-1 group. Long-let markets remain landlord-friendly relative to Europe, with fewer rent controls. TheReserve Bank of Australiatracks broader housing-finance conditions.
Dubai's DTCM (Department of Tourism and Commerce Marketing) licence is mandatory for all short-lets and now integrates with Ejari for compliance monitoring. The tourism dirham of AED 10–20 per bedroom per night applies, alongside operator fees. There is no personal income tax on rental income for individuals, which materially improves after-tax comparisons versus USA/UK/Canada/Australia. Long-lets in Dubai typically use annual cheque structures (1, 4, 6 or 12 payments), which affect cash-flow timing but not income. Abu Dhabi remains more restrictive; Sharjah and northern emirates have far thinner short-let demand.
Regulatory drift is not optional to model
Between 2020 and 2026, at least 40 Tier-1 city administrations tightened short-let rules. If your investment thesis assumes today's rules will still apply in five years, model the scenario where they do not. A regulation-shock case should be part of every underwriting.
Regulation and tax landscape at a glance
Selected Tier-1 short-let rules and taxes (indicative, verify locally)
Mandatory registration; host present required
Effective ban on unhosted <30 nights (Local Law 18)
None for <90 nights; planning permission above
Business licence; principal residence only
180 nights/year non-hosted (Greater Sydney)
Rules change frequently. Confirm registration, licensing, night caps, tax rates and reporting obligations with a locally licensed lawyer or tax adviser before you underwrite a purchase or convert a strategy.
How to read the regulatory table
Three practical reading rules. First, a "registration" requirement is not a light-touch step: in most Tier-1 cities the platform now suspends listings that fail to display a valid registration number, which means non-compliance is an operational cliff, not a slow drift. Second, night caps are enforced increasingly through platform data-sharing rather than field inspection — the Airbnb, Vrbo and Booking.com feeds now push booked-night totals to city databases in the UK, EU and parts of North America. Third, tax obligations are cumulative, not exclusive: in New York City a hosted short-let can owe federal income tax, state income tax, city hotel occupancy tax and state sales tax simultaneously, with different filing frequencies for each.
Insurance is where models silently break
Standard buy-to-let and homeowner policies typically exclude short-term paying guests. Specialist short-let cover from carriers such as Pikl, Guardhog, Proper Insure or major-broker equivalents in the USA and Australia adds 30–60% to the premium. Some lenders will demand the policy is in place before completion. If your comparison used a standard landlord premium for the short-let side, redo it. The gap on a 1-bedroom Tier-1 apartment can be £300–£800 a year — enough to move a marginal decision.
Financing differences to price in
Beyond the rate spread, three financing details deserve modelling. (1) Loan-to-value: many lenders cap short-let LTV at 65–70% versus 75–80% for long-lets, requiring more equity. (2) Stress rates: UK buy-to-let stress tests typically add 2 percentage points to the pay rate and require rental coverage of 125–145% of that stressed payment — using long-let comparable rent, not short-let projections. (3) Product breach: informally short-letting on a long-let mortgage is a common but genuine breach of covenant that can trigger repayment demands. A fair comparison uses the right mortgage product for each strategy, not the cheapest.
Common mistakes and myths
Mistake 1 — Comparing gross short-let revenue to net long-let rent
The most common error. £180 × 365 is not comparable to £1,300 × 12. Always take both to NOI before comparing.
Mistake 2 — Using peak-month ADR for the full year
Coastal, ski and city-break markets can have 4× ADR variance between peak and trough months. Blending is not enough — you need month-by-month projection to expose seasonality risk.
Mistake 3 — Forgetting the co-host is not free
A "hands-off" short-let assumes 20–30% management fees. Owners who model self-management and then hire a co-host in year two often see NOI collapse.
Mistake 4 — Assuming today's regulations will persist
New York, Barcelona, Vancouver, Amsterdam and London have all tightened rules within 24 months of loud political debate. If a debate is loud in your market today, model the tightening.
Mistake 5 — Ignoring furniture depreciation and refresh cycles
Short-let furnishings last 3–5 years, not 20. Amortise the £8,000–£25,000 setup cost across that horizon or your model overstates NOI by £2,000–£6,000 a year.
Myth 1 — "Short-lets always beat long-lets in tourist cities"
Only until supply catches up. When it does, occupancy compresses, ADR pressure builds, and net margins converge. Model with realistic 2026 competition, not 2019 romance.
Myth 2 — "Long-lets are boring, so returns must be lower"
Long-lets are boring for a reason: predictable cash flow, easier financing, lower workload, lower regulatory exposure. In risk-adjusted terms, that predictability is worth 100–300 basis points of yield.
Myth 3 — "Furnished holiday let tax breaks make short-lets a clear winner in the UK"
That was true before April 2025. The FHL regime was abolished, and short-let profits now sit under standard property income rules. Any post-2025 UK model must reflect this change.
Every one of the five mistakes above shifts NOI by 15–40%. Two of them stacked together will make a losing strategy look like a winner. Discipline your inputs harder than your ambitions.
How this connects to related property metrics
NOI is not the only lens. Once you have a fair NOI comparison, layer these related metrics to size the full picture.
Rental yield
Rental yield is annual gross (or net) rental income divided by property value. Gross yield flatters short-lets and cap rate flatters long-lets — use both. OurRental Yield Calculatorlets you toggle gross vs net and price in vacancy on the fly.
Cap rate
Capitalisation rate is NOI divided by purchase price. It is strategy-agnostic and is the fairest single-number comparison of two different properties. For a deeper walkthrough seeCap Rate Explained for Property Investorsand the trade-off analysis inCap Rate vs Cash Flow.
Cash-on-cash return
Cash-on-cash return is annual pre-tax cash flow divided by total cash invested (down payment plus closing plus initial furnishings). This is often where short-lets shine at low leverage and stumble at high leverage. SeeCash-on-Cash Return Explained.
DSCR (Debt-Service Coverage Ratio)
Lenders' favourite metric: NOI divided by annual debt service. Short-let DSCR products often demand 1.20–1.25× coverage using long-let comparable rent, not short-let projections, precisely because they distrust short-let volatility. ReadDSCR Explainedfor the underwriting mechanics.
Interest-only mortgages
Interest-only structures change cash flow but not NOI, and can flatter cash-on-cash return in the early years. Understand the mechanics before you underwrite; seeInterest-Only Mortgages Explained.
Break-even occupancy
The most important short-let-specific metric. Below break-even occupancy, the long-let wins. Above it, the short-let starts to pay for its risk premium. TheBreak-Even Occupancy Calculatorsolves the equation NOI(short-let, x) = NOI(long-let) for occupancy x, given your ADR, fees and cost stack. If the answer is above 65%, be sceptical: only a small minority of Tier-1 short-lets sustain that level year-round through a full cycle.
How the metrics fit together
Think of these metrics as a hierarchy. Yield gives you a fast filter to shortlist properties. Cap rate lets you compare properties on a strategy-agnostic basis. NOI is the honest income line. Cash-on-cash return brings in leverage. DSCR tells you what the lender will accept. Break-even occupancy tells you when the short-let strategy pays for its own risk. Use them in that order and you will rarely be surprised. Skip a layer and the surprise arrives in year two, when it is expensive.
Run the numbers with free calculators
Doing this on paper is a good discipline once. Doing it on paper for every property you consider is a good way to make expensive arithmetic mistakes. LashkariProperties provides four free, no-signup calculators built exactly for this workflow. Use them together — each fills a specific gap.
Model ADR, occupancy, seasonality, platform fees and cleaning turnover to project realistic short-let NOI.
Compute gross and net yield for any strategy on any Tier-1 property with vacancy and OpEx baked in.
Turn NOI into net cash flow after mortgage interest, principal, income tax and depreciation.
Instantly answer the single most important short-let question: what occupancy do I need to match a long-let?
A pragmatic workflow: start with the Rental Yield Calculator to see the long-let baseline; move to the Short-Let Income Calculator to project the alternative; use the Break-Even Occupancy Calculator to size the risk; finish with the Cash Flow Calculator to test whether the mortgage covers itself. Twenty minutes end-to-end, per property.
Inputs worth taking seriously
Two inputs deserve outsized care because small errors here dominate the model. First, occupancy: a 5-percentage-point overestimate compounds against you every month for twelve months, and it is the single most manipulated figure on marketing pages. Cross-check with two independent data sources and always favour the lower one. Second, management fees: an owner who models 15% self-management and then hires a co-host at 25% is running a model that is 40% more expensive than the projection. If there is any chance you will delegate, model the delegated cost from day one.
Outputs worth trusting
The calculators surface three outputs you should copy into your investment memo verbatim: (1) base-case NOI for each strategy, (2) break-even occupancy, and (3) the ADR at which the short-let matches the long-let assuming your target occupancy. Together, those three numbers describe the shape of the decision better than any single figure of merit.
Actionable framework and checklist
Print this or save it. Every property, every time.
- Confirmed short-let is legal at this address (local law, mortgage, HOA/strata).
- Pulled long-let rent from three currently advertised comparable listings within 500 m.
- Pulled short-let ADR and occupancy from three active listings within 1 km plus one market-data source.
- Built a month-by-month revenue projection for both strategies over the same 12-month window.
- Deducted every OpEx category — platform fees, cleaning, utilities, supplies, management, insurance, licence, maintenance, voids.
- Calculated NOI for both strategies and computed the short-let / long-let ratio.
- Applied the 1.30× fair-test threshold; documented whether the short-let clears it.
- Ran a downside scenario (ADR −15%, occupancy −15pp, costs +10%).
- Ran a regulation-shock scenario (90-night cap or full ban).
- Layered financing and income tax to reach net cash flow.
- Checked DSCR against lender criteria if using leverage.
- Cross-checked with the four LashkariProperties calculators.
- Documented the assumptions I would need to revisit annually (ADR, occupancy, rules, tax status).
Model your property in under 20 minutes
Plug your address, price and market rents into the four free LashkariProperties calculators and get a defensible NOI comparison — before you make an offer.
Frequently asked questions
Is short-let income really higher than long-let income?
Gross short-let income is typically 1.5–3× a long-let equivalent, but net income is usually only 1.0–1.6× once you deduct platform fees, cleaning, utilities, management and voids. The right comparison is net operating income after occupancy — not headline nightly rates.
What occupancy rate does a short-let need to beat a long-let?
In most Tier-1 city apartments, a short-let needs 50–60% annual occupancy at market ADR just to match a long-let after all costs. Below that break-even, the long-let wins on both net income and effort. Use theBreak-Even Occupancy Calculatorto solve for your specific property.
How do you compare short-let vs long-let fairly?
Use the same 12-month window, the same cost basis (all-in operating costs, not just fees), the same tax status, and calculate net operating income (NOI) for both. Then compare NOI — and stress-test occupancy by ±15 percentage points.
Which is safer, a short-let or a long-let?
Long-lets have lower revenue volatility, more predictable cash flow and easier financing. Short-lets carry regulatory, seasonality and demand risk. A useful rule of thumb is to require short-let net income to be at least 30% higher than long-let net income to justify the risk premium.
Do short-let regulations affect income in Tier-1 markets?
Yes. New York City effectively banned unhosted short stays under 30 days under Local Law 18; London caps unregistered short lets at 90 nights per calendar year; Toronto, Vancouver, Sydney and Dubai require registration or licences. Always check local rules before modelling short-let income.
How do taxes change the picture between short-let and long-let?
Short-lets are often taxed as a trade or hotel-like service (VAT/GST, transient occupancy taxes), while long-lets are usually taxed as passive rental income. Deductibility, depreciation, and business rates can differ significantly by country and state — verify with a local tax professional.
What is a fair management fee for a short-let?
Full-service short-let co-hosts typically charge 20–30% of gross booking revenue, plus a cleaning fee passed through to guests. Long-let letting agents in the UK, USA, Canada and Australia usually charge 8–12% of monthly rent for full management.
Should I choose a short-let for higher yield or a long-let for stability?
Choose based on regulation, financing, seasonality, and your appetite for hands-on management — not headline yield. If your address is legally restricted or your mortgage forbids short lets, the choice is made for you. Otherwise, model both, then pick the option with the better risk-adjusted net income.
Can I switch a long-let to a short-let later?
Often yes, subject to local licensing, mortgage terms, insurance, and HOA/strata rules. Some landlords use a hybrid model — long-let in shoulder seasons and short-let in peak season — but this requires careful cash-flow planning and a compliant tenancy agreement.
In the UK, a furnished holiday let is a property that meets specific occupancy tests (available 210 days a year, let 105 days, no long-term lets over 31 days beyond 155 days). Historically it enjoyed favourable tax treatment, though HMRC abolished the FHL regime from April 2025 — treatment now aligns more closely with standard property income.
How do I stress-test my short-let income estimate?
Run three scenarios: base (market ADR × market occupancy), downside (ADR −15%, occupancy −15pp), and shock (regulation change forcing 90-night cap). If the downside still beats a long-let, the short-let is robust. Use the LashkariProperties Break-Even Occupancy Calculator to size the risk.
Which Tier-1 markets favour short-lets in 2026?
Dubai and holiday-driven Australian coastal markets often show the strongest net-margin gap in favour of short-lets. Central London, New York City and Vancouver typically favour long-lets after regulation. Always model at the postcode/ZIP level — city averages hide big variance.
Conclusion and next steps
The real question is never "which strategy earns more?" — it is "which strategy earns more,afteroccupancy, operating costs, taxes and regulation,per unit of risk and effort?" That question can only be answered honestly with a like-for-like NOI comparison, a documented set of assumptions, and a downside case.
If you take three things from this guide, take these: compare on NOI, not on gross; require the short-let to clear a 30% NOI premium over the long-let before you commit; and always underwrite a regulation-shock case. Do that, and you will price short-let optionality without paying short-let hype.
The Tier-1 property markets in the USA, UK, Canada, Australia and UAE are entering the second half of the 2020s with far more sophisticated regulation, far more transparent platform data, and a far more critical lender base than they had five years ago. Investors who bring the same discipline to underwriting will find the environment rewarding. Investors who lean on last decade's headline numbers will find it punishing. The difference between the two, from where you sit today, is a spreadsheet and an hour of honest work.
Bookmark this page, run one property through the checklist, and come back to it the next time a broker or a friend tells you a story about nightly rates. You will have the vocabulary and the math to answer.
Open theShort-Let Income Calculatorand theRental Yield Calculatorin two browser tabs. Model a property you know. Read our companion guides onCap Rate vs Cash FlowandCash-on-Cash Returnto complete your investor toolkit.
This article does not constitute personalised financial, tax, mortgage, or legal advice. Rules and rates differ by country, state and city, and change frequently. Always verify numbers with a locally licensed professional before making a purchase, refinance, or letting decision.
Related guides
- Cap Rate Explained for Property Investors
- Cap Rate vs Cash Flow: Which Metric Should Guide Your Decision?
- Cash-on-Cash Return: How to Calculate It Properly
- Interest-Only Mortgages Explained: Risks, Uses, and Math
- DSCR Explained: The Investor Loan Metric That Matters
Tools mentioned in this article
Related reading
- Cash-on-Cash Return: How to Calculate It Properly
Learn how to calculate cash-on-cash return correctly with clear formulas, worked examples with and without leverage, common mistakes to avoid, and a step-by-step framework for property investors in the USA, UK, Canada, A
- How to Calculate ROI on a Rental Property — The Complete 2026 Investor Guide
Learn how to calculate ROI on a rental property the right way. Total ROI vs cash-on-cash, hidden costs most investors forget, worked examples for USA, UK, Canada, Australia and UAE — plus free calculators.
- Price-to-Rent Ratio: What It Signals About Rent vs Buy Markets
Learn what the price-to-rent ratio really tells you about a housing market, how it differs across Tier-1 cities (US, UK, Canada, Australia, UAE), and how to combine it with a personal rent-vs-buy calculation before you b