
Buying Guides
How to Compare Two Mortgage Offers Fairly — A Buyer's Side-by-Side Framework
By LashkariProperties Team · August 5, 2026 · 29 min read

Why comparing mortgage offers is genuinely hard
You have two offer letters on the desk in front of you. Both are for the same house, the same purchase price, the same down payment. One shows a note rate of6.25%with an APR of6.41%. The other shows6.375%with an APR of6.44%. Which is cheaper?
Most buyers pick the lower rate. Some pick the lower APR. A surprising number pick whichever lender was friendliest on the phone. All three approaches can be wrong — because a mortgage offer is not a single price. It is a bundle of at least four independent costs, each with different timing, each with different rules for how it is disclosed, and each with different consequences if your life plan changes.
In this guide, we translate every mortgage offer letter — the US Loan Estimate, the UK ESIS, the Canadian Cost of Credit Disclosure, the Australian Key Facts Sheet, the UAE offer letter — into the same normalised comparison. You will finish with a reusable framework, three worked examples, a Tier-1 market cheat-sheet and a printable checklist. Along the way we will run the numbers on the same three free tools we use internally at LashkariProperties: theloan comparison calculator, themortgage calculatorand theclosing cost calculator.
Educational content, not personalised advice
Everything in this article is educational. Mortgage regulation, tax treatment and disclosure formats vary by country, state and product. Before you sign, verify the numbers with a licensed broker, attorney or tax professional in your jurisdiction.
What makes two offers look similar but behave differently
The core reason offer letters are hard to compare is that lenders monetise the same loan in different places. One lender may lead on rate and recover margin through the origination fee; another may lead on fees and recover through a higher rate that generates a lender premium in the secondary market; a third may embed the cost inside prepayment penalties that only fire under specific conditions. All three offers can be individually legitimate, priced to a consistent internal yield target, and yet produce dramatically different lifetime costs for the same borrower.
Regulators across every Tier-1 market have tried to fix this with a single standardised disclosure — the US Loan Estimate, the UK ESIS, the Canadian Cost of Credit box, the Australian Key Facts Sheet, the UAE offer letter. They help, but each was designed with a specific borrower model in mind (usually one who holds the loan to term at the initial rate). Real borrowers refinance, move, inherit lump sums, remortgage into a new fix, and — in the case of investors — sell into a rising or falling market long before the disclosure's assumed horizon. The disclosures compare offers on the wrong holding period for the majority of real users.
The framework in this guide corrects for that. Rather than trusting any single disclosed number, we treat each offer as a stack of four independent costs, compare them layer by layer, then aggregate them atyourrealistic holding period. It is the same approach institutional mortgage buyers use when they price whole-loan portfolios — only reduced to a form a single household can execute in half an hour on the kitchen table.
Key definitions and formulas you need first
Before we compare anything, we need shared vocabulary. Every one of the terms below appears — sometimes under a different name — on the offer letters used in every Tier-1 market.
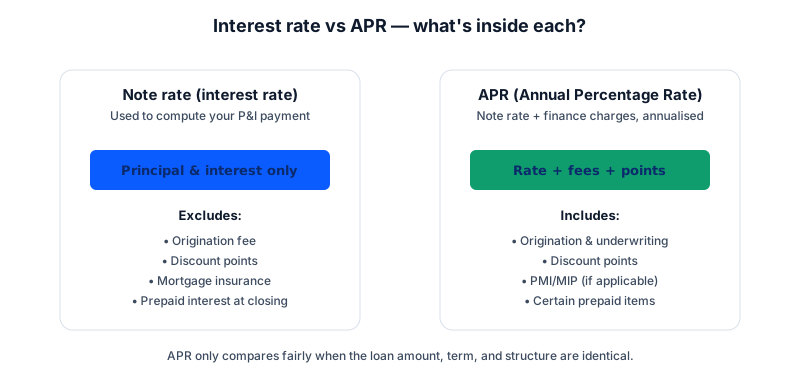
Note rate (also: interest rate, contract rate, initial rate)
The percentage used to calculate your monthly principal-and-interest payment. On a fixed-rate loan the note rate is constant. On an adjustable-rate mortgage (ARM in the US, tracker or SVR-linked in the UK, variable in AU/CA/UAE) it changes on a defined schedule after an initial fixed period.
APR (Annual Percentage Rate)
The note rate plus most finance-related fees, spread across the loan's full term and re-expressed as an annualised percentage. APR is designed for shopping. It isnotthe rate used to compute your payment. In the US, APR is defined by Regulation Z of the Truth in Lending Act. In the UK, the equivalent is APRC. In Canada it is called APR but includes different fee categories. In Australia it is called thecomparison rate. In the UAE it is thereducing-balance effective rate.
Discount points (buy-down points)
Optional upfront fee paid to the lender to reduce the note rate. One point equals 1% of the loan amount. Typical rate reduction per point is 0.20%–0.30% but varies by lender, product and market conditions.
Origination fee
The lender's charge for processing and underwriting the loan. Usually 0.5%–1.5% of the loan amount. In the US this is disclosed in Section A of the Loan Estimate; in the UK as the arrangement or product fee; in Canada as the lender fee; in Australia as the application/settlement fee; in the UAE as the processing fee (capped at 1% by the Central Bank).
Discount points break-even (months)
Formula:
Break-even months = Total cost of points ÷ (Monthly payment without points − Monthly payment with points)
Total cost of borrowing over hold period H (months)
Formula:
TCoB(H) = Upfront cash to close + (Monthly P&I × H) + Remaining principal at month H − Loan amount
This single formula, run for both offers at your realistic H, produces the fairest apples-to-apples number.
Total finance charge
Also called the total interest percentage (TIP) in the US or the total amount payable in the UK. It is the dollar/pound sum of every interest and fee payment across the loan's disclosed term. Two offers with the same APR can have different total finance charges if their amortisation schedules differ (interest-only periods, offset accounts, biweekly payment options, and so on). Always compare total finance chargein addition toAPR — never instead of it.
Lender credit
A negative fee: the lender pays part of your closing costs in exchange for a higher note rate. Legitimate and sometimes correct for short-hold buyers, but never free. Every dollar of lender credit is recovered through interest over time — usually within 30–48 months.
Rate lock
A commitment from the lender to hold the quoted rate for a specified window (typically 30–90 days in the US, 3–6 months in the UK, 90–120 days in Canada, 60–90 days in Australia, and 30–60 days in the UAE). Longer locks are more expensive, but they insulate you from market moves between offer and closing. Never compare a 30-day lock against a 90-day lock — the price difference is not competitive information, it is duration cost.
Prepayment penalty (also: ERC, IRD, break cost)
A charge applied when you repay the loan ahead of schedule. Rare on US conforming loans, standard on UK fixed-rate products (Early Repayment Charges), standard on Canadian fixed-rate products (Interest-Rate-Differential), standard on Australian fixed-rate products (break costs), and capped by regulation in the UAE. This is the single most under-read section on any offer letter.
"Comparing mortgages on rate alone is like comparing cars on top speed alone — you are optimising for one attribute out of a dozen that actually matter."
Why fair comparison matters for buyers, investors and landlords
On a $400,000 30-year fixed mortgage, a difference of just 0.25% in note rate is worth roughly$21,000over the life of the loan. A single unnecessary origination point is worth$4,000in cash at closing. A prepayment penalty triggered by a refinance three years in can cost another$8,000–$15,000. Together, these easily reach the price of a modest kitchen renovation — and they are all decided by which offer letter you sign.
The stakes scale up further if you buy multiple properties. A landlord acquiring three rental homes in Manchester, Melbourne or Miami is signing three mortgage offers within a year. A 0.15% miscomparison replicated three times becomes a five-figure drag on lifetime cash flow — the difference between a portfolio that finances itself and one that requires monthly top-ups from your salary.
For first-time buyers, fair comparison also protects against a subtler risk:anchoring on the wrong number. Lenders know that most consumers focus on the note rate. Some price their offers with a low note rate and higher fees; others do the opposite. Neither is dishonest — but a buyer who only reads the top of the offer letter will systematically choose whichever product is designed for shoppers who compare rates and ignore fees.
If you are running the numbers on a specific purchase, ourpractical affordability frameworkpairs naturally with this guide — first size the loan, then compare offers on that loan.
Why investors and landlords need a tighter comparison
For an owner-occupier, a bad mortgage comparison costs money. For a buy-to-let investor, it can invert the entire deal thesis. Rental yields in most Tier-1 metros have compressed to 3%–5% gross — often 2%–3.5% net after taxes, insurance, maintenance and voids. A financing cost that is 0.30% higher than it needed to be can consume 10%–15% of the entire net cash flow of the property. Across a five-year hold with mortgage rate risk on top, that miscalculation is easily the difference between a profitable rental and a portfolio drag.
Investors also face a structural disadvantage on comparison: buy-to-let and investment-property offer letters typically carry higher rates, more restrictive prepayment clauses, and more variability in fee structure than owner-occupied products. The dispersion between the cheapest and most expensive competitive offer is wider — which means the payoff from doing this properly is larger, not smaller.
Why comparison quality compounds over multiple properties
Portfolio landlords often normalise on their first lender: they get a good rate on property one, then use the same broker for properties two, three and four out of inertia. Every one of those repeated financings is another chance to leave money on the table. Applying this framework once per acquisition — treating each offer letter as a fresh comparison against at least two rivals — is the difference between a portfolio that scales cleanly and one that develops a hidden cost drag as it grows.
The 6-step side-by-side framework
The goal of this framework is to reduce two offer letters — no matter which market they come from — to two comparable numbers: total cost over your realistic holding period, and worst-case cost under stress. Everything else is intermediate output.
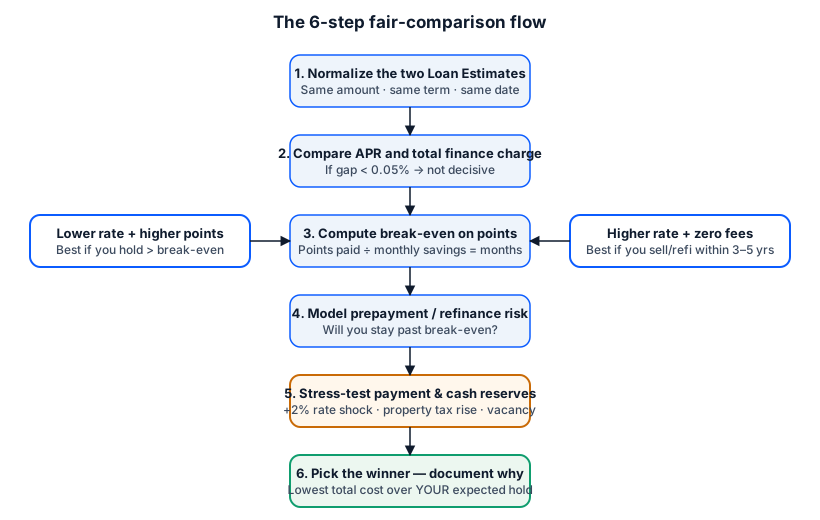
Step 1 — Normalize both loan estimates
You cannot fairly compare a $400,000 30-year fixed at 20% down from Lender A against a $410,000 25-year fixed at 15% down from Lender B. Before anything else, request both offers on thesame loan amount, same term, same product type, same lock period, and issued within a 24–48 hour window. This eliminates every source of price movement that is not the lender's own margin.
If Lender A quotes on a 30-year and Lender B insists on a 25-year, ask both for both. Reputable lenders in every Tier-1 market will re-quote within a business day. A common trick is to arrive at an under-competitive offer by quoting on a slightly different structure — a 10/6 ARM against a 30-year fixed, a two-year discount tracker against a five-year fix. The moment structures diverge, comparison is meaningless. Insist on symmetry before you look at numbers.
Also verify that both offers assume the same credit score band, the same debt-to-income calculation and the same appraised value. In the US, an appraisal delta of $10,000 can shift the loan into a different LTV bucket and change the pricing entirely. In the UK, a valuation coming in below purchase price will re-band the LTV within seconds and every lender will re-price. Ask each lender to confirm the pricing inputs in writing.
Step 2 — Compare APR and total finance charge
Now that both offers are normalised, APR becomes a legitimate first filter. If Offer A's APR is more than0.10 percentage pointslower than Offer B, and both share the same term and lock, Offer A is usually cheaper — but not always. A wide APR gap driven by high points can flip if you sell early. Read the total finance charge figure below the APR: this is the sum of every dollar or pound of interest and fee you will pay if you keep the loan to term.
A useful diagnostic: divide the APR–note-rate gap by the loan amount and multiply by term. If that number is close to the sum of upfront fees, the two figures reconcile — and you know the disclosure is consistent. If they do not reconcile, one of the two offers has either a missing fee or an unusually structured cost item hidden further down the letter. Ask the lender for a plain-language walk-through of every difference between the note rate and the APR before moving on.
Step 3 — Compute the break-even on discount points
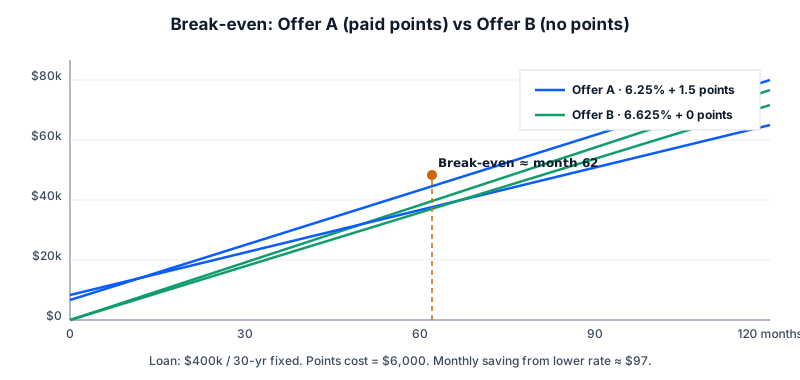
This is the single most under-used calculation in retail mortgage shopping. If Offer A has a lower note rate because of paid points, compute:
Break-even months = Point cost ÷ Monthly saving
Compare that number to your realistic holding period. If you plan to sell or refinance in 5 years and the break-even is 7 years, the points are a bad trade — even if APR looks lower.
A tighter version of the calculation accounts for the fact that the money spent on points has an opportunity cost. If you would otherwise invest that cash at a modest return — say 4% in a money-market account — the true break-even lengthens by roughly 10%–20% depending on the rate environment. For high-net-worth buyers whose alternative use of capital is another property purchase, the effective opportunity cost is even higher, and points rarely justify themselves except on very long holds.
Step 4 — Model prepayment and refinance risk
Every offer letter has a prepayment section. Read it. In the US, most conforming loans have no prepayment penalty, but some non-QM and portfolio loans do. In Canada, fixed-rate mortgages use anInterest-Rate-Differential (IRD)formula that can easily produce a five-figure penalty. In the UK,Early Repayment Charges (ERC)taper over the fixed period, typically 5% year one down to 1% year five. In Australia,break costson fixed-rate loans can be substantial. In the UAE, the Central Bank caps prepayment penalties at 1% of the outstanding balance or AED 10,000, whichever is lower.
Estimate the penalty you would owe at year three of the loan. That is the single most useful stress test, because year three is when refinance opportunities most commonly appear (either from a fall in market rates or from a life event). If the year-three penalty on either offer exceeds one full year of the note rate's savings versus the alternative offer, the prepayment clause is doing more harm than the rate is doing good.
Also check whether the offer permitspartialprepayments — annual lump-sum privileges that let you pay down 10%–20% of the balance each year without penalty. These are common in Canada and Australia, less common in the UK, and largely irrelevant in the US where prepayment is generally unrestricted. Where offered, they materially improve the flexibility of an otherwise-penalising product.
Step 5 — Stress-test the payment and cash reserves
Model three shocks: a 2-percentage-point rate rise at first reset (relevant for ARMs, trackers, variable and short-fix products), a 15% property-tax or insurance increase, and — for landlords — three months of vacancy. The offer that keeps you above your debt-service coverage minimum in all three scenarios is the safer one, even if it is slightly more expensive today.
For adjustable products, look beyond the first reset. Model the payment at thelifetime cap— the maximum the rate can reach under the note. On a US 7/6 ARM with a 5/1/5 cap structure and a starting rate of 6.0%, the lifetime maximum is 11.0%; the monthly payment on a $400,000 loan rises from $2,398 to $3,809, a 59% increase. If your household budget cannot absorb that jump for a plausible year or two while refinancing options are explored, the ARM is not the right product no matter how attractive its APR looks today.
Step 6 — Pick the winner and document why
Write a one-page rationale: "I chose Offer B because at my realistic 6-year hold, its total cost is $3,470 lower after including a $2,100 origination credit and no prepayment penalty." This document is worth its weight in gold six months later when you receive a competing refinance pitch and need to remember exactly why you signed what you signed.
Three worked numerical examples
Each example uses realistic 2026 pricing and the framework above. Every arithmetic step is shown so you can verify with a mortgage calculator or a spreadsheet.
Example 1 — US 30-year fixed, points vs no points
Setup:$400,000 loan, 30-year fixed, purchase closing in 45 days.
US example — same loan amount and term, different pricing structures
Analysis:Offer A's APR looks better by 0.28%. But the buyer plans to sell within 5 years. At month 60, Offer A has cost $6,000 in points plus $147,780 in P&I = $153,780. Offer B has cost $153,660 in P&I plus $6,300 less in cash-to-close =net savings ≈ $6,420 for Offer B. The lower-rate offer loses.
Never pay discount points unless your realistic holding period exceeds the break-even by at least 30%. A 61-month break-even needs an ~80-month hold to be a confident win.
Example 2 — UK 5-year fixed with different arrangement fees
Setup:£320,000 mortgage, 25-year term, 5-year fix, London flat purchase.
UK example — fee-loaded vs fee-free product, same lender
Analysis:Product A saves£1,241over the fix. The APRC looks similar because it assumes SVR beyond year 5, which no one actually stays on. Since UK borrowers typically remortgage at the end of every fix, the APRC is misleading — the real comparison isinitial-period total cost.
Example 3 — Canadian 5-year fixed with different prepayment terms
Setup:C$500,000 mortgage, 25-year amortisation, 5-year fixed, Toronto.
Canadian example — headline rate vs prepayment flexibility
Analysis:Offer A's rate is 0.20% lower and saves C$3,540 over the fix. But if rates drop and the borrower refinances at year 3, the posted-rate IRD penalty on Offer A wipes out the savingalmost three times over. For a borrower who values optionality — anyone who might sell, refinance or blend-and-extend — Offer B is the mathematically better trade.
Tier-1 market nuances
The framework is universal; the paperwork is not. Below is a snapshot of what changes between the five Tier-1 markets our readers most frequently ask about.
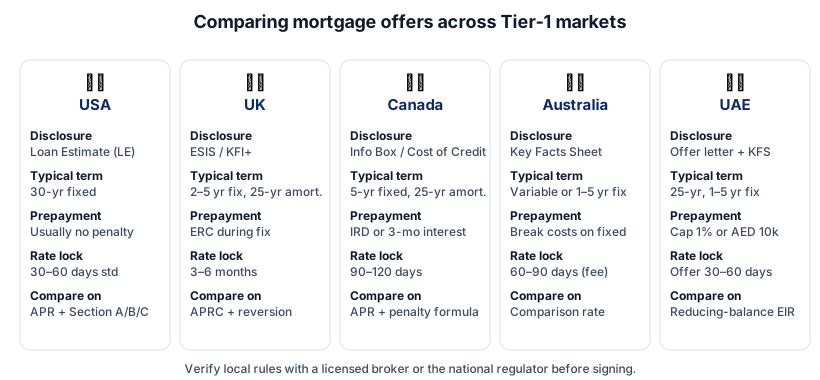
TheLoan Estimate (LE)is the gold standard for comparison. Its three pages are federally standardised: Section A lists lender-controlled origination charges (this is where offers differ most), Section B/C lists third-party services, and page 3 shows the APR, total interest percentage (TIP) and total finance charge. Federal law requires the LE within three business days of application. Prepayment penalties are rare on conforming loans but common onnon-QM products — the CFPB publishes a full guide.
UK borrowers receive anESIS (European Standardised Information Sheet)— sometimes called a KFI+. Focus on the initial period cost and the reversion rate rather than APRC, because virtually no UK borrower ever pays SVR for the full residual term. Early Repayment Charges are the single biggest hidden cost — always compute the ERC you would owe if you moved lender mid-fix. See the FCA'sconsumer guidance on mortgagesfor regulatory basics.
Canada
Canadian offers disclose theCost of Creditin an information box. The single biggest source of hidden cost is theIRD (interest-rate-differential) penalty formulaused by the Big Six banks. Monoline lenders often use a friendlier 3-month interest penalty. Compare not just the rate, but the exact wording of the penalty clause. Prepayment privileges (10% vs 20%) matter more than most borrowers realise. TheFinancial Consumer Agency of Canadapublishes worked penalty examples.
Australia
Australian lenders must publish aKey Facts Sheetunder NCCP legislation. The mandated shopping figure is thecomparison rate, which bundles the note rate with standard fees over a 25-year, A$150,000 loan. That reference amount is far below most real Sydney or Melbourne mortgages, so the comparison rate tends tounderstatefee impact on larger loans. Break costs on fixed-rate mortgages can be substantial when swap rates move against the lender — a critical consideration for anyone considering a 3–5 year fix.
UAE mortgage offers are governed by theCentral Bank of the UAE mortgage regulations. Processing fees are capped at 1% of the loan; prepayment penalties are capped at 1% or AED 10,000, whichever is lower. Loans use areducing-balance effective rate— always confirm the quoted rate is not a flat-rate approximation. Loan-to-value caps are higher than most Tier-1 markets, so the interaction with down-payment sizing is a key part of the comparison.
Cross-border buyers frequently apply the wrong metric to the wrong market — for example, using US APR intuition on a UK APRC, or comparing an Australian comparison rate to a Canadian contract rate. Always match the metric to the market, and use a licensed local broker to translate.
Common mistakes and myths
Myth 1: "The lower rate always wins"
False. As Example 1 showed, a low rate bought with points loses if you sell before break-even. Rate is one variable in a four-variable optimisation.
Myth 2: "APR is the honest single number"
APR is a decent shopping filter but it makes two assumptions that rarely hold: you keep the loan the full term, and the rate never changes. Both assumptions break routinely in the UK, Canada, Australia and UAE — and often in the US too.
Myth 3: "Shopping around hurts your credit"
In the US and Canada, all mortgage credit inquiries within a 14–45 day window count as a single inquiry for scoring purposes. Compare three to five lenders concurrently; the credit impact is negligible.
Myth 4: "Lender credits are free money"
Lender credits are financed by a higher note rate. They are legitimate — sometimes correct — but they are not free. Always run the break-even the opposite way: how many months until the higher rate exceeds the credit you received?
Myth 5: "Prepayment penalties don't matter if I'm not planning to move"
Life plans change. A job relocation, an inheritance, a divorce, a rate drop that makes refinancing compelling — any of these can force a prepayment. A meaningful penalty caps every one of those options.
Myth 6: "The lender with the best online reviews has the best offer"
Online reviews measure service quality and closing experience — both important, neither correlated with price. Some of the best-priced lenders have thin retail brands; some of the most highly rated brokers charge a premium precisely because their service is worth it. Separate the two decisions: pick the cheapest fair offer, then evaluate whether the closing experience is worth the delta versus a competitor.
Mistake 6: Comparing offers on different days
Mortgage-backed security markets move daily. An offer from Monday and an offer from Thursday can differ by 0.10%–0.20% purely on market moves, not lender competitiveness.
Mistake 7: Ignoring third-party fee shopping
In the US Loan Estimate Section C, you can shop for title insurance, survey and pest inspection. In the UK you can shop for the valuation-linked conveyancer. In Canada and Australia you can choose your own solicitor. Independent providers can be 20–40% cheaper than lender-panel providers.
Mistake 8: Treating the pre-approval rate as the final rate
Pre-approval rates are not offers. They are illustrative estimates based on the lender's rate sheet at that moment, subject to full underwriting, appraisal, and market movement between pre-approval and final offer. Comparing pre-approval numbers from two lenders is only useful for a rough triage; the real comparison happens once both have issued a signed offer letter or Loan Estimate against an accepted purchase contract.
Mistake 9: Skipping the payment reconciliation
Two offers with the same rate, term and loan amount should produce the same monthly principal-and-interest payment to the cent. If they do not, one has an escrow item hidden inside the P&I line, or an amortisation schedule that assumes something non-standard. Always reconcile the payment against a standard amortisation calculator before comparing anything else.
Mistake 10: Anchoring on a discounted "teaser" period
A 2-year fix at 4.19% followed by an SVR of 7.99% is a very different product from a 5-year fix at 4.49% reverting to the same SVR — even though the initial numbers look similar. Compare theblended cost across your expected hold, not the teaser rate alone. This mistake is especially common in the UK, where product marketing routinely emphasises the initial rate.
How this connects to other property metrics
Mortgage comparison does not live in isolation. The offer you choose reshapes every downstream metric in your investment or homeownership model.
Affordability— a lower monthly payment expands the price you can offer on a house. If you are still sizing the loan, start withhow much house you can affordbefore ranking offers.
Cash flow (for landlords)— for a rental, the monthly payment feeds directly into cash-on-cash return. A 0.25% rate difference on a leveraged buy-to-let can flip a property from cash-flow-positive to cash-flow-neutral.
Capital growth exposure— a smaller cash-to-close means more capital available for a second deposit. Compare the "money left over" scenario after each offer.
Down payment structuring— sometimes the fairer comparison is between a 15% down offer with PMI and a 20% down offer without. Readwhether a 20% down payment is really requiredbefore framing the ask.
Closing costs— the third-party costs in every offer letter are best modelled separately. Ourclosing costs explainer for buyerswalks through each line.
Rent vs buy— if the cheapest mortgage offer still produces a payment above local rents plus capital-growth expectations, renting may be the better financial choice. See ournumbers-first rent-vs-buy framework.
Debt-service coverage (for investors)— many buy-to-let lenders in the UK and specialty investor lenders in the US, Canada, Australia and UAE require the property's rental income to cover the mortgage payment at a stressed rate by 125%–145%. The offer with the lower stressed payment may unlock a higher borrowing amount, even if the headline rate is not the market's lowest. Fair comparison must include this feasibility dimension, not just cost.
Loan-to-value tiering— most Tier-1 lenders price in LTV bands (e.g. 60%, 75%, 80%, 90%). A borrower on the edge of a band can sometimes save more by shifting $5,000 more into the down payment than by switching lenders entirely. Run the LTV-band question before locking either offer.
Run the numbers with free LashkariProperties calculators
Every calculation in this article can be reproduced in under five minutes using three free tools. None require an account and none capture personal financial data.
Three calculators, one workflow
Paste each offer into the loan comparison tool, verify the monthly payment against the mortgage calculator, then confirm the cash-to-close with the closing cost calculator. If any two disagree, one offer letter has a mistake.
Loan comparison calculator
Theloan comparison calculatoris the workhorse. It takes two full loan estimates side-by-side, computes APR, total finance charge, monthly P&I and break-even for you, and outputs a single "winner at your holding period" verdict. Use it as the primary tool for Step 2 through Step 6 of the framework above.
Mortgage calculator
Themortgage calculatorcomputes the monthly P&I and full amortisation schedule for any single offer. Use it to verify that each offer's disclosed monthly payment reconciles with the note rate and term — a surprising number of offer letters contain arithmetic errors on this line, and a two-minute cross-check catches them. Ourstep-by-step guide to calculating mortgage paymentswalks through the formula in detail.
Closing cost calculator
Theclosing cost calculatorestimates the total third-party and prepaid line items you will owe at settlement, by state or region. Use it to sanity-check Section B/C of a US Loan Estimate — or the equivalent third-party costs on UK, Canadian, Australian and UAE offers — before you commit.
The actionable checklist
Print or save this checklist. Run every mortgage offer you receive through the same list, and never sign until every item has been ticked.
- Both offers issued on the same day (or within 48 hours), for the same loan amount, term and product.
- Same rate-lock period on both offers.
- Note rate, APR and total finance charge extracted and written down side-by-side.
- Origination fee (Section A / arrangement fee / lender fee) compared line-by-line.
- Discount points cost recorded and break-even months calculated.
- Realistic holding period estimated (be honest: most borrowers refinance or move within 7–10 years).
- Prepayment penalty clause read in full — for Canada, ask specifically for a worked IRD example.
- Lender credits included in the cash-to-close total, not treated as free.
- Third-party services in Section C shopped independently for at least title and survey.
- Payment stress-tested at +2% rate shock (for ARM/variable products) and +15% tax/insurance.
- For landlords: three-month vacancy scenario tested against reserves.
- Winner selected with a one-page written rationale filed for future reference.
Six months later, when a broker offers to refinance you, that written rationale is your defence against being sold something worse dressed up as something better.
Frequently asked questions
What is the fairest single number for comparing two mortgage offers?
Total cost of borrowing over yourexpected holding period— not APR, not the note rate, not the monthly payment alone. APR is the best single headline number, but only when both offers share the same loan amount, term and product type. For anyone likely to sell or refinance within 10 years, hold-period cost is the better metric.
Is a lower APR always the better mortgage offer?
No. APR spreads fees across the full loan term, so an offer with high points and a low rate can show a lower APR while being more expensive if you sell or refinance before break-even. Always pair APR with a hold-period cost projection.
How do I calculate the break-even point on discount points?
Divide the total dollar cost of the points by the monthly payment saving generated by the lower rate. The result is the number of months you must keep the loan for the points to pay for themselves. If your realistic holding period is shorter, decline the points.
Should I compare mortgage offers on the same day?
Yes. Mortgage pricing moves daily and sometimes intra-day. Request Loan Estimates or offer letters from every lender within a 24–48 hour window, and use identical loan amount, term and lock period so the numbers reflect the same market.
Does a prepayment penalty matter if I plan to keep the loan?
It still matters. Life plans change — a job move, a windfall, or falling rates can make refinancing attractive. A meaningful prepayment penalty caps your options and can more than wipe out the savings of a slightly lower rate.
What is the difference between the note rate and APR?
The note rate is the interest rate used to calculate your monthly principal-and-interest payment. APR bundles the note rate with lender fees, points and certain prepaid items, then expresses the total as an annualised percentage. The note rate drives payments; APR is a shopping filter.
Do closing costs count when comparing mortgage offers?
Yes. Compare Section A (origination) and Section B/C (services) of the US Loan Estimate — or the equivalent line items on UK, Canadian, Australian and UAE offer letters — line by line. Third-party costs (title, appraisal, taxes) are less lender-dependent but still affect cash-to-close.
Can I negotiate a mortgage offer after receiving it?
Often, yes. Show the lower offer to the higher-priced lender and ask them to match or beat it on rate, origination fee or lender credits. Lenders can usually adjust discretionary items even when the underlying pricing engine is fixed.
How many mortgage offers should I compare?
At least three: one big-bank offer, one independent-broker offer and one credit-union or building-society offer. Shopping among three or more lenders is associated with meaningful savings without hurting your credit if done within a short window.
Does the UK APRC work the same way as US APR?
No. The UK APRC assumes you keep the mortgage for its full term at the reversion rate after the fixed period ends. In the US, APR assumes the note rate stays constant. Compare UK offers on the initial-period cost plus the reversion rate — not APRC alone.
Do rate locks affect a mortgage comparison?
Yes. A longer lock is more expensive but insulates you from market moves. Compare offers on the same lock length, and factor in the fee for extending the lock if closing is delayed beyond expiry.
What free calculators help me compare two mortgage offers?
LashkariProperties offers a freeloan comparison calculatorthat runs both offers side-by-side, amortgage calculatorthat computes monthly payment and amortisation, and aclosing cost calculatorthat estimates cash-to-close. Together they replicate this article's framework in minutes.
Conclusion and next steps
Comparing two mortgage offers fairly is a five-minute discipline once you have the framework. Normalise the two loan estimates, extract the APR and total finance charge, compute the break-even on any points, model the prepayment clause, stress-test the payment and pick the winner at your realistic holding period. Every offer letter — in every Tier-1 market — reduces to the same six-step check.
The single largest financial decision most households will ever make deserves at least half an hour of comparison. The alternative is signing on the strength of a friendly phone call and a headline rate — and paying five figures more than you had to.
Ready to run your own comparison?
Open the loan comparison calculator, paste both offer letters into it side-by-side, and let the tool compute APR, break-even and hold-period cost automatically.
Continue reading
How Much House Can I Afford? A Practical Numbers Framework
How to Calculate Mortgage Payments Step by Step
Is a 20% Down Payment Required? What Buyers Actually Need
Closing Costs Explained: What Home Buyers Actually Pay
Rent vs Buy: A Numbers-First Decision Framework
This article is for general educational purposes only. It is not personalised financial, tax, mortgage or legal advice, and does not consider your individual circumstances. Mortgage rates, fees, disclosure rules and tax treatment vary by country, state and product, and change over time. Always verify the specific numbers on your own offer letter with a licensed mortgage broker, attorney or tax professional in your jurisdiction before signing. Past pricing and worked examples are illustrative and do not represent guaranteed rates or returns.
Tools mentioned in this article
Mortgage Calculator
Estimate monthly mortgage payments, total interest, and payoff based on price, down payment, rate, and term.
Loan Comparison Calculator
Compare two mortgage offers side by side, including fees, to find the cheaper total cost.
Stamp Duty & Transfer Tax Calculator
Estimate property transfer tax or stamp duty using banded rates for major markets.
Related reading
- How Much House Can I Afford? A Practical Numbers Framework
Calculate a sustainable home-buying budget using income, debts, rates, down payment, total housing costs and realistic stress tests.
- Are Extra Mortgage Payments Worth It? Interest Savings Math
Are extra mortgage payments worth it? See the interest-savings math behind biweekly, extra-monthly and lump-sum prepayments, plus when investing wins instead — with worked examples for US, UK, Canada, Australia and UAE b
- Closing Costs Explained: What Home Buyers Actually Pay
Closing costs surprise most first-time buyers. Learn exactly which fees you pay at closing, who covers what, how to estimate cash to close, and how to compare offers across the US, UK, Canada, Australia and UAE.